Keep connected
Our investment management team is made up of engaged thought leaders. Get their latest commentary and stay informed of their frequent media interviews, all delivered to your inbox.
John Zechner
May 24, 2018
In theory this should lead to more strength in the energy stocks, which are expected to report a profit gain of 86% this year, or roughly four times the pace of expected annual profit growth. Higher commodity prices have also boosting stocks in Canada, even though Canadian crude oil sells at a significant discount. But far from rallying to new highs with the rest of the market, Canadian energy stocks are merely rebounding from low levels and remain well off recent highs. The energy index is now up slightly this year after being down over 16% in mid-March, but is still over 35% below the last peak in 2014.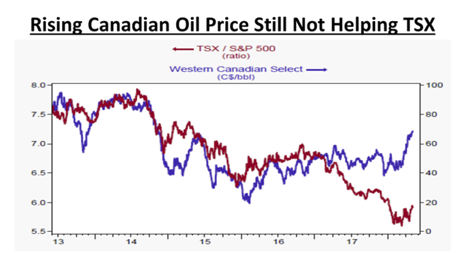
At the same time, U.S. President Donald Trump announced that the United States is pulling out of the Iran nuclear deal, known as the Joint Comprehensive Plan of Action (JCPOA). The United States will impose further economic penalties against Iran, including a requirement that allies in Europe and Asia cut their oil imports from the country. That may sound bullish for oil and energy stocks, but it raises geopolitical risks in the Middle East and may prompt OPEC to raise its oil output to gain market share. The rise of shale oil has also changed the overall economics of the industry as the U.S. responds differently to oil price moves now than in the past because of the specific properties of shale oil. While oil from most other sources—conventional wells, deep underwater, and tar sands—flows for decades after the initial investments are made, most of the oil from a typical shale well is extracted in the first three years. Just maintaining output requires constant additional drilling. Rising prices quickly encourage additional investment, while low prices lead to sharp cuts in spending. When oil prices were high, oil-related investments provided a noticeable lift to the U.S. economy. From 2010 through the middle of 2014, the spending boom on exploration, shafts, wells, and machinery directly added 0.15% to the U.S. economy’s average yearly growth rate. The subsequent collapse in oil prices in 2015 eventually lead to weaker U.S. economic growth in 2015-16, particularly in the northern states as well as Texas and Oklahoma.
Outside of the recent weakness we have seen in Europe and Japan, another warning flag is rising in the emerging economies of the world, high-lighted by the sharp falls in some EM currencies such as the Brazilian Real, the Mexican Peso and the Turkish Lira. The bottom line is that rising U.S. interest rates and higher oil prices are putting new pressures on emerging economies. Are we re-visiting the 1997-98 EM crisis? For more than two years, developing nations had it easy as yield-chasing investors poured billions into them, sometimes ignoring weak external finances and monetary-policy complacency. Central bankers came under pressure from politicians who wanted to keep interest rates low and sustain high deficits to please voters. They had little sense of urgency to fix their economies because capital flows remained buoyant and markets always rebounded from mini selloffs. Since the start of 2016, bond investors had put $1.5-trillion into new debt issues by emerging-market governments and corporates. Emerging market stocks added $8-trillion in market capitalization between January 2016 and January 2018. One emerging-market exchange-traded fund (ETF) has gone almost six years without a single day of outflows. But after Treasury yields crossed the 3% threshold in late April, something snapped in the relationship between emerging markets and global investors. Between mounting debt loads, weakening terms of trade, rising global interest rates and stalling growth, developing nations are worse off than during their two most recent moments of weakness, the 2008 global financial crisis and 2013 taper tantrum. During those periods, emerging market stocks endured routs of 64% and 17%, respectively.
Finally, going back to where we started, the first quarter earnings reports in the U.S. were quite bullish and many market commentaries focused on the ‘initially tepid’ response to those strong numbers, at least until the share buybacks started kicking back in. Many investors are wondering why markets have not been stronger. But we need to remember that the stock market is really a forward-looking entity and reacts more to the next wave of information or anything that is different from consensus expectations. Expected news is generally reflected in existing prices. The sharp gain for global stock markets in 2017 was in anticipation of the growth we are now seeing. In order for markets to rise further, there has to be some evidence that growth will continue at elevated rates. So it should be no surprise that as impressive bottom-line (and top-line for that matter) numbers continue to roll through, equity investors continue to be mostly unimpressed. The S&P 500 has gained less than 2% in price for the year, a far cry from the 25% jump in year-over-year profits for the index. While that seems odd on the surface, a look back in time says that’s pretty much how it works this late in the economic cycle. This relationship is more visible in the following data sets from Ned Davis Research, which shows the relationship between various levels of earnings growth versus stock returns for the S&P500 over the past ninety years.
| Earnings growth (YoY) | Annualized S&P 500 gain |
| >20% | 2.60% |
| 10%-20% | 7.40% |
| -10% to 10% | 9.20% |
| -25% to -10% | 25% |
| <-25% | -23.70% |
Source: Charles Schwab, Ned Davis Research
Another problem for markets and economic growth is the excessive financial leverage that has been created in order to get the global economy to its current growth and level. Despite years of deleveraging after the 2008 global financial crisis, debt is still high, and we have returned to an expansionary credit cycle. According to The Bank for International Settlements, total nonfinancial private and public debt amounts to almost 245% of global gross domestic product last year, up from 210% before the financial crisis and about 190% at the end of 2001. The world has endured enough economic crises to know that high debts create serious risks. Nominal debt is fixed, but asset prices can collapse, generating huge balance-sheet losses and causing borrowing costs to rise. Ten years ago, a credit-fueled financial boom quickly turned to bust, the over-levered financial sector was pushed to the brink of collapse, and a recession followed. Times may be good, but that’s when risks build up. We can’t say we weren’t warned!
1 2
Our investment management team is made up of engaged thought leaders. Get their latest commentary and stay informed of their frequent media interviews, all delivered to your inbox.