Keep connected
Our investment management team is made up of engaged thought leaders. Get their latest commentary and stay informed of their frequent media interviews, all delivered to your inbox.
John Zechner
September 30, 2018
But the great punch bowl of global liquidity is now being slowly withdrawn as central banks move to more ‘neutral’ policies as opposed to the extremely ‘easy’ policies of the past decade. To that end, the net purchases of bonds by the Fed, ECB, and BOJ will go from $100 billion a month in the fourth quarter of 2017 to zero starting in this year’s fourth quarter. While the Fed’s balance sheet inflation since 2009 has inflated all sorts of asset prices, the serious reduction of its balance sheet should have just the opposite effect, namely to deflate asset prices. These strains are beginning to be felt in the weakest links of the global financial system: the emerging markets, primarily Turkey, Argentina, Venezuela and South Africa. The firming U.S. dollar is also exacerbating emerging market stress as it did in the late 1990s, with risks of financial contagion from the currency turmoil increasing in these countries and putting downward pressure on their economic growth.
While Emerging Markets in total are down almost 20% from their January highs, the U.S. stock market continues to trade near its all-time high, not unlike what we saw during the technology bubble of the late 1990s. Some of this outperformance is due to the fact that the U.S. economy has been the standout economic performer so far this year but also because the stronger U.S. dollar has attracted capital, to the detriment of other global currencies. But the 2018 gains in the U.S. market have been concentrated in a way that is very reminiscent of the tech bubble. Six FAANG stocks (Amazon, Apple, Microsoft, Alphabet, Facebook and Netflix) are up 28% so far this year and account for over 50% of the rise in the S&P500 Index while the other 494 stocks in the S&P500 are up less than 4%. The combined weight of those six stocks now exceeds 17% of the S&P500 Index, which reminds us of the waning days of the tech bubble, when the largest six growth stocks (Oracle, Cisco, Intel, Lucent, Microsoft and Dell) had also risen to account for 17% of the index. Fast forward 20 years to see what those stocks have done since that time, we see that Dell was taken private at a price far below its 1999 high while Lucent was absorbed into Ericcson to avoid bankruptcy. Microsoft and Oracle took 15 years to get back to their 1999 levels while Cisco and Intel have still not returned to their prior peaks, despite 20 years of decent earnings growth. Their valuations simply got too far ahead of long-term averages and it took that long for the stocks to grow back into their fair valuations.
Other indicators are pointing to the risk of another financial crisis, not the least of which has been the massive growth in global debt over the past ten years. This has not been limited to government debt but also now includes corporate debt, which in the U.S. is now higher than it’s ever been! This is typically manageable if companies have a lot of cash to service that debt. But a looming problem is that the corporate debt-to-cash ratio is now higher than it was in 2008 during the financial crisis. This tells us that corporations are borrowing against their net worth, as opposed to borrowing against cash flow and income, which in effect is the same thing households were doing in 2004-2006. S&P Global reported U.S. corporate debt at a massive $6.3 trillion in June. Meanwhile, riskier borrowers are more leveraged than ever before. The cash-to-debt ratio of speculative-grade borrowers reached a record low of 12% in 2017, below the 14% level in 2008, just before the last financial crisis. The bottom line is that the low interest rate policy lead to an explosion of debt supported by dubious credit, at a time when interest rates are starting to head in the other direction! We are not alone in pointing out some of the risks ahead for stock markets. Merrill Lynch declared that “the great bull market is dead,” killed by rising interest rates, high corporate debt levels and slowing economic growth. As the Fed and others end asset purchases and gradually raise rates, investors will have to brace for significant changes. They conclude that “The Fed is now in the midst of a tightening cycle, ignoring structural deflation, focusing on cyclical inflation. Until this Fed hiking cycle ends we suspect absolute returns from financial assets will remain slim & volatile”.
The strength of global stock markets last year was attributed mostly to the strong underlying global growth. However we now see some growing risks to that story. Preliminary OECD GDP data for Q2 show that global economic momentum is deteriorating at a rapid pace. In fact, the breadth in OECD countries’ GDP posting accelerating growth has fallen to only 32% in Q2/18. This is down from 46% in Q1/18 and 80% in Q2/17. Moreover, the breadth in OECD countries’ rising LEIs remains depressed at 23% which means that global growth is expected to continue softening in H2 regardless of trade tariffs. The simultaneous increase in the US$, interest rates and crude oil in H1 is such that the US economy is not escaping the slowdown with the Citi economic surprise index falling to an 11-month low.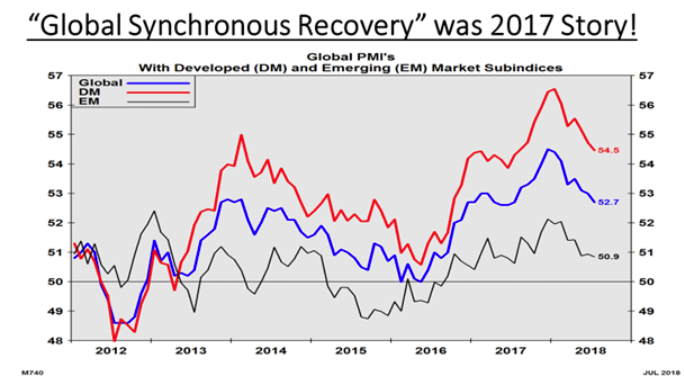
Our investment management team is made up of engaged thought leaders. Get their latest commentary and stay informed of their frequent media interviews, all delivered to your inbox.