Keep connected
Our investment management team is made up of engaged thought leaders. Get their latest commentary and stay informed of their frequent media interviews, all delivered to your inbox.
John Zechner
May 30, 2020
Stocks continued rising in May, but at a more subdued pace than the prior month, even though we did begin to see a broadening out of the gains and a rotation from the ‘stay at home safety trade’ that had favoured defensive and technology stocks towards the ‘value-oriented’ cyclical stock groups that would benefit most from a ‘re-opening’ of the global economic. U.S. stocks jumped over 4% in May and, even though the tech-heavy Nasdaq Index lead the way with a 6.7% gain, the more broadly based Russell2000 Index also rose by 6.4%. Global markets rallied too with Japanese stocks up over 8% and Germany up over 6%. The biggest surprise in our view was Brazil, where the 8.5% gain in the Bovespa index seemed at odds with that country’s emergence as the new epi-centre of Covid19 infections. The only weak spots were in India (down 3.8%) and China (Shanghai down 0.3% and Hong Kong losing 6.8%). Canadian stocks also rallied, gaining 2.8% lead by further gains in technology stocks (primarily Shopfiy), more strength in the gold and base metals stocks and a recovery in the health care and consumer discretionary stocks on optimism about more store openings. Index heavyweight bank and energy stocks lagged the gains, though, despite the gain in oil prices and banks mostly keeping dividends intact.
The bottom line though, is that after rallying more than 35% off the March lows, many are starting to wonder if there is some sort of major disconnect between the beliefs of stock market investors and the reality of the economic numbers! The rally and the optimism since those lows have really been driven in large part by three key factors:
While a very old stock market adage is that “hope is not an investment strategy’, hope that the economy will return to pre-pandemic levels and a successful medical remedy will become available does seem to be behind much of the bullish move in stocks. Sometimes pictures tell a much better story than words. This is one of those cases as shown below where we see the bullish move in stocks has the majority of almost every stock sector trading well above their 50-day moving averages, suggesting very extended short-term trading levels.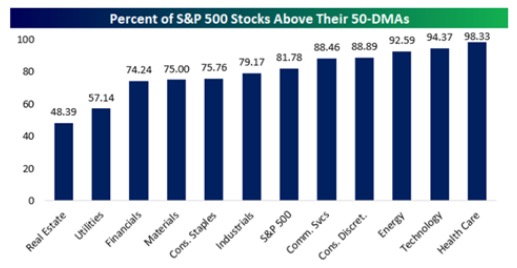
Conversely, the trend in earnings estimates for each of the four quarters of this calendar year have been consistently revised downwards, at an accelerating pace in the past few months. The downward trend remained in place in May after most companies reported their first quarter numbers and then withdrew guidance on numbers for the rest of the year. While stock markets have been celebrating, that joy has yet to be reflected in analysts estimates of earnings for the balance of this year. Perhaps investors have just decided to look ‘across the chasm’ and believe that conditions will go back to normal in 2021, but we have to wonder if this again is too optimistic an assumption.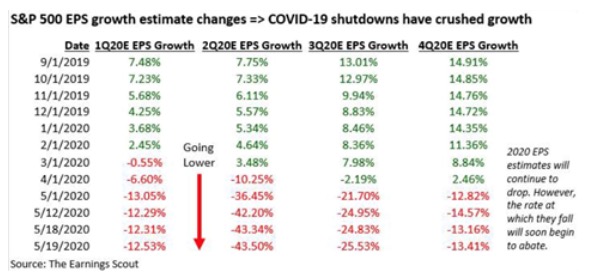
The stock market’s uncoupling from economic reality seems to underscore the dilemma facing global policymakers in the battle against the coronavirus. The $15 trillion-plus pledged in global stimulus inflated stock markets over the last two months as investors took heart that governments will not let the global economy completely melt down. But these funds will not make people more comfortable going into many stores, restaurants, movie theatres or theme parks, let alone getting on an airplane or taking a cruise. The biggest risk for stocks remains the fact that the money cannot engineer the type of V-shaped recovery that investors are now paying for. Those sobering calls are coming true elsewhere as we look at the experience of countries in Asia, which had dealt with the virus for longer than the West and have had their economies fully open much longer now. There we see that even after months of lockdown, consumers haven’t come out ‘en masse’ to dine or shop, reducing the likelihood of a V-shaped recovery if similar behaviour occurs here. Our worry that the initial bounce in growth will be smaller and more gradual than hoped for. The risk of a downside surprise looks much greater than the likelihood of an upside surprise at this point. J.P. Morgan strategists think the rally could continue but investors “should not overstay their welcome in the bounce” that could peter out by summer if labor indicators weaken. All the more reason to keep a keen eye on real-time economic data. The chart below shows the short-term disconnect between economic data and stock market returns where we show the U.S. Composite Leading Indicator versus the S&P500. The sharp divergence in the past two months indicate that either the U.S. is headed for a very sharp economic recovery very soon or else stocks have gotten way ‘too far in front of their skis.’ Our bet would be on the latter!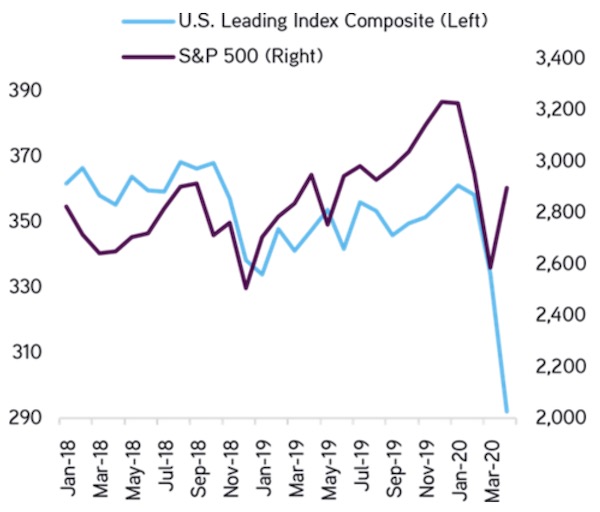
1 2
Our investment management team is made up of engaged thought leaders. Get their latest commentary and stay informed of their frequent media interviews, all delivered to your inbox.