Keep connected
Our investment management team is made up of engaged thought leaders. Get their latest commentary and stay informed of their frequent media interviews, all delivered to your inbox.
John Zechner
December 31, 2018
After swallowing markets from Germany to China, the bears finally reached U.S. shores. While the U.S. had been held up by stronger economic growth and better corporate profits, inflated by the 2017 tax cuts, those walls came crumbling down in December as U.S. stocks had their worst close to the year since the great depression, with the previously invincible FAANG stocks leading the decline. Apple, Facebook, Amazon, Netflix, AMD and Nvidia were among the biggest losers as investors rushed for the exit in a much less orderly way than they came into these ‘over-owned’ names. In the end, the U.S. was simply the final pin to fall in a cascade of declines that populated the overall global investment landscape in 2018 as central banks started to slowly withdraw the ‘punchbowl’ of low interest rates that had funded a bubble in financial assets.
With one trading day left, here’s a look at how some key assets have done this year:
Those numbers are for the year in total but the bear market was effectively a ‘rolling’ affair as Emerging Markets peaked at the end of 2017, Europe and China were unable to find their way back to anywhere near their February highs. While the U.S. did have one more run to new highs in September, that all changed on October 3rd, when U.S. Federal Reserve Chairman Jerome Powell, made the unfortunate comment that U.S. interest rates were still a ‘long way’ from the normal level that the central bank was ultimately moving towards. For a stock market that effectively was a ‘junkie’ for low interest rates, the idea that rates would probably be increased another four times in the next year was the ‘straw that broke the camel’s back.’ After a tough October, stocks rebounded somewhat in mid-November on optimism about a possible truce in the US/China trade dispute, a resumption of the stock buybacks that had lifted the market for much of the past two years and a bit of a soft retraction from Chairman Powell on his earlier comments. But that optimism proved to be short-lived as the flood new selling, some high profile earnings shortfalls and a reduction in 2019 guidance on a weaker global economic outlook all conspired to send stocks tumbling aggressively from those lofty levels. By the time Christmas Eve rolled around, not only had the traditional ‘Santa Claus Rally’ failed to arrive, the market had its worst December 24th ever and several key indices such as the Nasdaq Index officially moved into the definition of a ‘bear market’, with a 20% decline from the prior peak.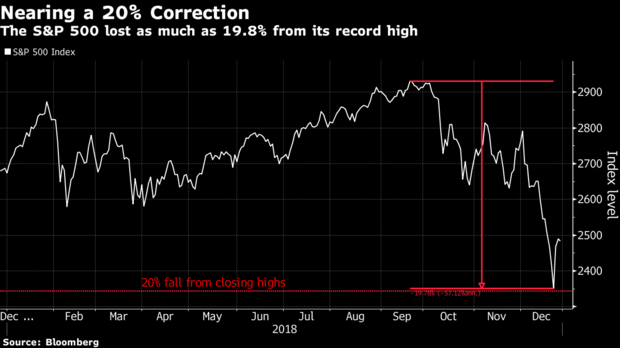
Before getting totally panicked about the recent weakness, it has to be pointed out that these sorts of short-term declines are hardly unprecedented and should not be blamed entirely on ‘algorithmic trading’, passive ETF investing or the ‘rise of the machines’ in quantitative trading. The largest percentage changes, except for 1987, were in the ’20s and ’30s. There were dramatic moves then without any electronic trading. More recent periods of sharp stock market declines, though, have generally preceded full-blown bear markets. The dot-com bubble that had been developing since the late 1990s popped in March 2000, when the S&P 500 lost 35% over the course of two months. It then took the Nasdaq Composite Index 15 years to get to its old high. In 1987, the S&P 500 rose 36% between January and August, in what was set to be the best year in almost three decades. Then the October sell-off on Black Monday pushed it into a 31% correction over just 15 days, much of it occurring in that one infamous session. Some investors may recall 1962, when the S&P 500 Index lost a quarter of its value between March and June 1962. The rout, known as the Kennedy Slide came after the S&P 500 advanced 79% in the prior four years. After that, the market was essentially flat over the next two decades.
While markets have been fighting back a bit in the last week of December, the outlook is not great. For one, the world economic outlook is weakening and profit growth has peaked for this cycle, in our view. Leading economic indicators from the industrialized (OECD) countries have fallen for twelve straight months with European and Asian growth slowing. GDP growth was actually negative in both Japan and Germany in the third quarter!. While the U.S. exhibited relative strength, we have seen recent weakness in housing, industrial production and many sentiment indicators. While headline inflation numbers are still contained, we are seeing rising input costs and other price pressures which have necessitated the continued removal of the easy money conditions that have characterized the last ten years. Record global debt levels and rising interest rates should lead to retrenchment in consumer and business spending thus limiting further expansion. Profit margins have peaked due to rising input costs (wages, basic materials), while the U.S. tax cuts are now diminishing in impact. Pre-tax earnings growth has dropped to almost zero and we expect overall profit growth to come in below expectations in 2019, perhaps going negative. When high-growth, investor-darling tech stocks fall prey, it shows optimism about growth is fizzling. And segments such as the Russell 2000 small-cap benchmark are stuck deep in the bear market territory. Small firms often carry higher debt loads than larger peers so falling share prices highlight credit risks. Fears about slowing economic growth and higher interest rates, along with tariff concerns, have dogged the broader stock market since the start of the fourth quarter. Those issues have particularly dented the appeal of small-caps, which often struggle for traction as economic expansions have neared their end, partially because they get hit hard by pressures like rising wages and borrowing costs. The underperformance of small-caps is a tell-tale sign of the real reason for this selloff. Trade headlines have caused volatility, but the bigger issue is the prospect of slowing growth and the tightening of financial conditions, which are a tough current for small-caps to swim against. Small-caps, along with large U.S. multinational companies, are facing lower earnings expectations in 2019 as tailwinds from corporate tax cuts are expected to fade. The stocks are also correlated to the rising and falling of an economic tide: Shares of small-caps went into a free fall as banks were reining in credit ahead of the financial crisis in 2008, one of the early indicators of the recession. The fact that shares of small U.S. companies have underperformed their larger peers in recent months is a clear shift from earlier in the year, when investors flocked to small-caps as a shelter from trade-related tensions.
Our investment management team is made up of engaged thought leaders. Get their latest commentary and stay informed of their frequent media interviews, all delivered to your inbox.