Keep connected
Our investment management team is made up of engaged thought leaders. Get their latest commentary and stay informed of their frequent media interviews, all delivered to your inbox.
John Zechner
November 30, 2020
The other risk in stocks right now is that traditional valuation levels look to be very extended compared to long-term averages. Price earnings multiples are close to record levels, on almost all measures. The CAPE (Cyclically Adjusted Price Earnings), at 32 times, is back to where it was in September 2018, ahead of a 20% pullback in the fourth quarter of that year, which had to be recovered by a reversal in Fed policy. The ratio of the S&P500 market cap-to-GDP hit a record high 130%, breaking above the ‘dotcom bubble’ peak over two decades ago. Market Cap to GDP is a long-term valuation indicator that has become popular in recent years, thanks to Warren Buffett. Back in 2001, he remarked in a Fortune Magazine interview that “it is probably the best single measure of where valuations stand at any given moment.” Well, as shown in the chart below, this measure is also back at record levels, perhaps explaining why the ‘Sage of Omaha’ has not been a particularly aggressive buyer of stocks recently. 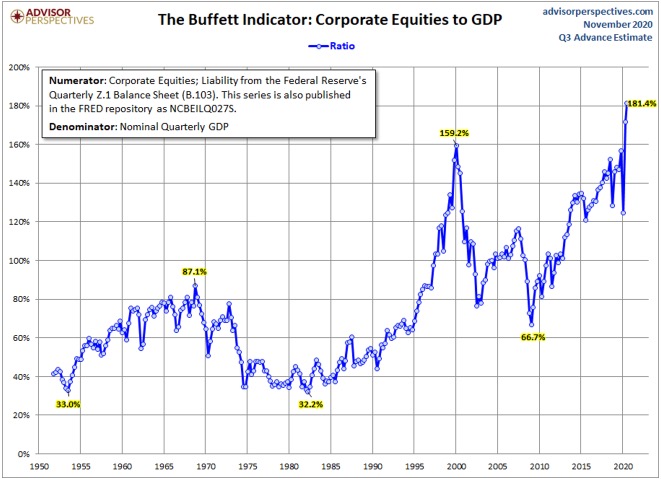
So, we can see that investor sentiment appears too bullish and stock valuations are up around record levels. So why do we remain overweight on stocks? Part of the answer is that the alternatives remain even less attractive. Cash returns are near zero and we see negative returns coming from the bond market, as we expect long-term interest rates to rise slowly. In that environment, stocks with stable earnings, a positive profit outlook and dividend yields often double those of bonds still look like a better option for investors even if there is some near-term risk of a pullback or correction. We believe we are early in a new economic cycle and would prefer to err on the side of growth over the medium term. Back in the economy, the data has been generally positive despite risks from ‘second wave’ shutdowns. Retail sales have been resilient, housing markets in both Canada and the U.S. remain extremely strong and CEO confidence measures suggest a return of capital spending next year, particularly since most companies have taken advantage of easy credit conditions to improve their financial positions. In the factory space, production was up solidly in October, but remains about 6% below pre-Covid levels. Overseas economic data has been strong as well, particularly in Asia where the virus has been brought under control. Emerging market economies have also been recovering, helped by some recent weakness in the U.S. dollar. The European data has also been on an uptrend, although the recent wave of shutdowns on the continent and in Britain could slow that recovery.
Bottom line, as shown in the chart below of the ECRI Weekly Leading Index, the data looks remarkably similar to that seen in 2009, when the global economy was crawling out of the hole of the Financial Crisis. We believe that the recession is now in the ‘rear view mirror’ and that some pent-up consumer spending, a recovery in corporate spending and continued fiscal and monetary support will become the backstop for a return to global economic growth in 2021. Clearly there will be other issues to deal with further down the road, including how to service and pay down the enormous debts accumulated in the past year. This will limit the ultimate pace of the economic recovery, but the early numbers will still be substantial, much like they were back in 2010. While stocks reflect much of this potential improvement in economic conditions, a continued profit recovery should provide support for stocks, even given their extended valuations. Moreover, central banks have indicated that their support will extend well beyond the early stages of recovery, meaning that short term interest rates will most likely remain lower for longer than they have in prior periods of recovery.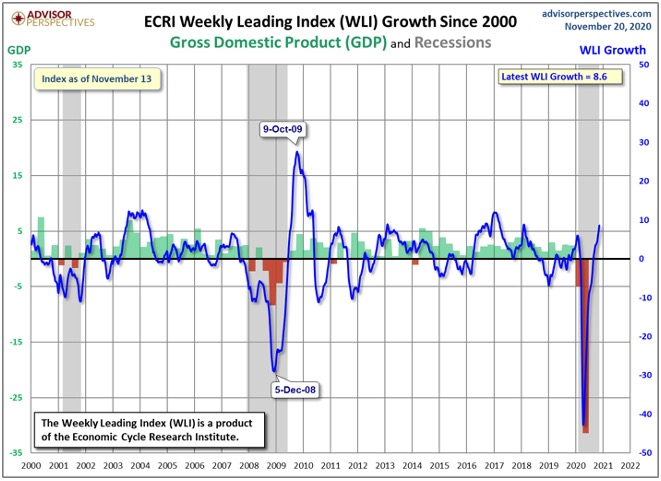
We can’t argue the view that market fundamentals and sentiment seem extremely overbought at current levels, we also have no real ability to ‘time’ when any correction might take place and don’t want to sit on the sidelines and watch stocks rise another 10-15% before finally succumbing to a pullback. In terms of our own investment strategy, we had added more cyclical exposure a few months ago and continue to stick with those stocks and sectors as valuations are much more attractive and the earnings rebound in 2021 could be significant. This also seems supported by the rhetoric we have been getting from the CEOs of these companies in their third quarter earnings calls (i.e. Stelco, Teck Resources, Nutrien, GM, BRP Inc, Caterpillar, 3M as well as most of the lumber and auto parts companies we spoke with). We also added to financials on both sides of the border as we see good tailwinds for bank stocks from improving loan losses, strong capital markets fees/trading and slightly higher longer-term interest rates. On the other side, we have reduced exposure to the large tech stocks that have been the leaders for most of 2020 (i.e. Apple, Microsoft and Alphabet).
We reduced gold exposure in late summer but are now looking to add back to some of those names as bullion prices have fallen by 15% from the peak and the gold stocks are down as much as 30%! On top of that, the weaker dollar, rising inflation expectations, falling real yields and ongoing market volatility should all continue to boost prices The conditions that drove gold to an all-time high this year are very much still in place. It’s just natural that once you get to an all-time high in an asset class, there’s some consolidation afterwards and that’s what we’ve seen in the gold stocks. The same logic could be applied to the stock market overall, which is why we have reduced some total exposure but still retain an overweight position and would look to add back to those existing positions on any market pullbacks.
Watching how people have adjusted so quickly to new realities should encourage everyone about the resilience and adaptability of consumers as well as a positive outlook on a different type of economic growth. During the pandemic, ten years of consumer adoption of e-commerce was compressed into three months, according to a recent survey by McKinsey. Adoption has varied by age, since younger people were already more likely to shop—and do everything else—online. A survey from digital consultancy Mobiquity found a 47% increase in the number of baby boomers reporting they had ordered delivery from a restaurant through a website or app; a 193% increase in the number ordering groceries through a website or app; and a 469% increase in the number who had used telemedicine. Nearly 9 in 10 boomer respondents said they’ll continue to use such technologies even after the pandemic ends. Delivering all these goods and services wouldn’t be possible without a rapid shift in where hundreds of thousands—eventually, probably millions— are employed. From the start of 2020 through the end of October, Amazon added 400,000 workers, the overwhelming majority in its e-commerce distribution system, including warehouses and delivery. That’s the equivalent of the entire workforce of Home Depot. And unlike the company’s annual holiday surge of temporary hiring, these are permanent positions. A lot has changed in 2020 and it has been a year that none of us will forget anytime soon. The fact that the global financial system has withstood these challenges and that economic growth is expected to be on a rebound in 2021 has to make most investors a bit more comfortable about investing for the long term.
1 2
Our investment management team is made up of engaged thought leaders. Get their latest commentary and stay informed of their frequent media interviews, all delivered to your inbox.