Keep connected
Our investment management team is made up of engaged thought leaders. Get their latest commentary and stay informed of their frequent media interviews, all delivered to your inbox.
John Zechner
October 1, 2026
September lived up to its billing of being the toughest and most volatile month for stocks, although the continued surge in U.S. tech stocks helped keep those markets mostly ‘in the green’ for the month despite the headwinds of surging bond yields and weakness in the commodity sector. The Federal Reserve under new chairman Kevin Warsh raised interest rates by ¼ point at their conclusion of their September 16th meeting and also gave signals that they will most likely be raising rates further (irrespective of what Trump wants) as they need policy action designed to support a “timelier return to the Committee’s 2 percent goal”, which it has remained well above for the last five years. Warsh highlighted that the Fed needs to be confident that underlying inflation is moving toward their objective “clearly and at sufficient speed”. He noted that recent summer inflation readings did not indicate that underlying trends had meaningfully improved yet. This hawkishness from central bankers put a scare into fixed income investors, which then saw longer-term interest rates move to their highest levels since 2007. While the ‘AI’ story continued to put a bid under the big tech names (including a >25% monthly gain for Meta) the rest of the stock market wilted. The TSX Index in Canada was down over 2.5% on the month, driven in large part by the 7% drop in the commodity heavy basic materials sector but also hurt by weakness in interest sensitive sectors such as telecom (-8.9%), utilities (-3.2%) and real estate (-3.4%). Similarly, in the U.S., the technology heavy Nasdaq Index was up 1.8% on the month but broader-based measures were much weaker with the Dow Industrials off 4.3%, the Dow Transports down 9.0% and the Dow Utilities falling 5.0%. Likewise, the smaller cap stocks, which are better indicators of the overall strength of the economy, faltered with the Russell2000 Index down 5.4% in September. Consumer stocks were particularly weak despite the bravado from many strategists and politicians about how well the economy is doing
Distant memories of 1987! We must look back a long way, but we see some similarities to the trends in 1987, that ended with the Dow having its worst day since the Great Depression, falling over 22% on October 19th of that year. Like 1987, interest rates were creeping higher all year and ultimately became too much of a headwind for stock valuations. Also, in 1987, the stock market saw its peak in August and then went into a slow withdrawal before the sharp October drop. This year, the equal-weight S&P500 Index is off more than -5% from the mid-August highs and completely flat since the middle of June. This suggests that cracks are emerging in the bullish stock story and we need to be paying attention to what is happening beneath the surface. Such as the fact that we are down to just a 26% share of S&P500 members this month trading above their respective 50-day moving averages, which is a classic case of eroding market breadth, and breadth typically leads prices. There is also massive concentration in the biggest names in the index (which also happened before the bursting of the tech bubble in 2001). The top ten stocks today command north of a 40% share of the S&P500 market cap, and that compares to less than 30% back at the 2000 bubble peak. We would also push back against the notion that this Fed-led surge in bond yields is not exerting an impact. The KBW banking index is down -9.5% from the nearby highs, and the economic- and rate-sensitive Russell 2000 has peeled back -7.5%. When we assess the sectors and subsectors of the S&P 500 that are most hitched to interest rates, they are down -9% collectively from their recent summertime highs and back to where they were at the beginning of the year. As always, we agree that long-term ‘buy and hold’ is the best strategy for maximizing returns in the stock market. However, at times we get a series of signals that strongly suggest it is a good time to lower expectations and get more defensive in terms of the stocks and sectors where we invest. This appears to be one of those times!
We keep hearing the rhetoric about how great economic growth has been in the U.S. The actual data does not back up that claim as the numbers are more reflective of what the U.S. is; a mature economy. Over the past 3 years (leading up to mid-2026), U.S. real GDP growth has averaged roughly 2.3% to 2.5% annually, reflecting a steady normalization following the post-pandemic recovery surges.
2023: ~3.4% (driven by resilient consumer spending and robust labour markets)
2024: ~2.4% (marking a gradual cooling toward trend growth)
2025: ~2.0% (reflecting continued normalization and tighter monetary policy impacts)
Growth into early and mid-2026 has continued to moderate, annualized at around 1.5% to 2.1% per quarter. Moreover, that has occurred even with the massive spending on AI capex (over $1 trillion this year including infrastructure spending) and continued deficit spending in the U.S. to fund tax breaks without offsetting spending declines. The U.S. fiscal deficit continues to run at over 6% of GDP, a level historically unheard of in a period where there was no recession or major war. Basically, the U.S. economic levers are running ‘pedal to the metal’ and yet can only generate economic growth of 2.3%!
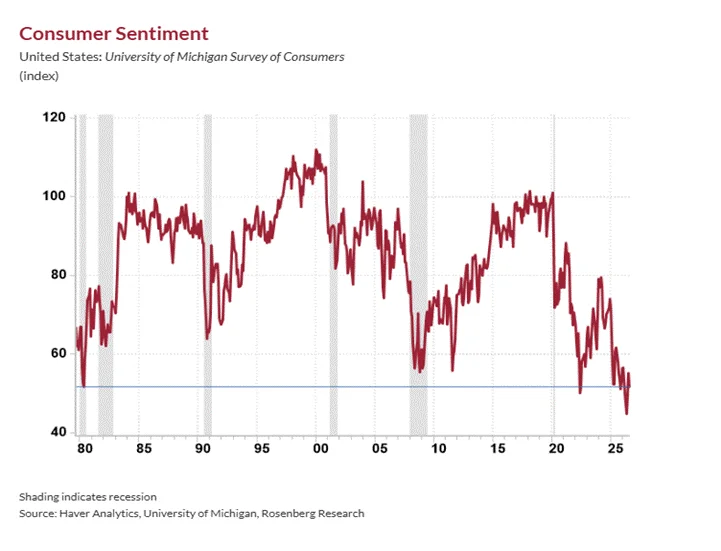
On top of that, the growth has not been broadly-based, something which you would want to see in a sustained advance. Half of the growth in the U.S. economy over the past year has come from the AI spending boom, and the other half has been derived by the equity wealth effect on consumer spending at the top tier of the wealth and income strata. While the higher end consumer continues to spend freely on travel and other indulgences, we look at the numbers coming out from Walmart and Home Depot, which are more reflective of the underlying economy and investing public. Those numbers have missed estimates and forecasts have been reduced over the last three quarters. Countering these claims that the U.S. economy is reaccelerating, surveys of consumer sentiment are rolling over to recessionary levels, and several CEO polls have begun to sputter as well. The chart below of the Michigan Survey of consumer sentiment has sunk to multi-decade lows this year.
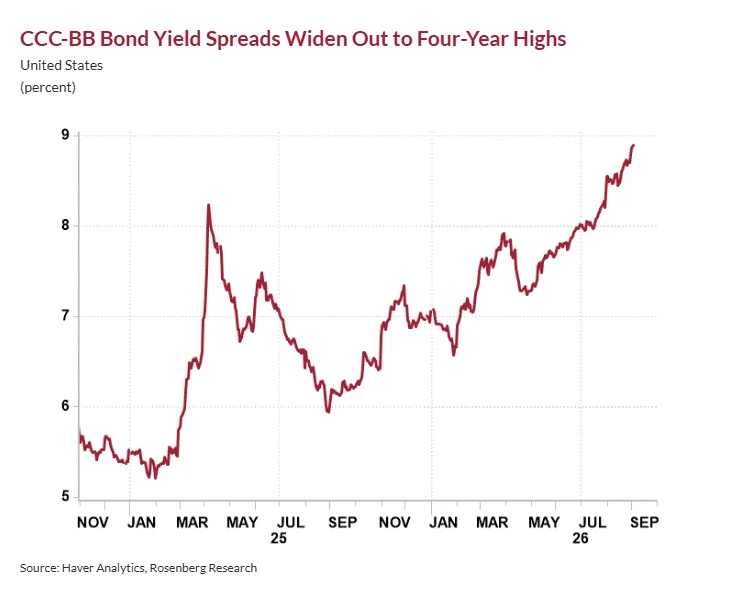
‘Junk’ (non-investment grade) bond spreads are also pointing out warnings as credit spreads increase to the highest level in four years. While everyone seems to believe that all is well in the world of corporate credit, the canary in the coal mine is what is happening in terms of quality spreads within this space, because CCC-rated (and lower) spreads have been widening out and signaling tighter financial conditions in the weakest tranche of the business sector. It is never an encouraging signpost when problems begin to surface in the deeper speculative-grade debt market, as we saw in 2007. While on the surface it can be said that the run-up in the stock market has taken the run-up in Treasury yields in stride, signs of weakness are emerging under the hood as shown in the chart below.
Big Tech’s off-balance-sheet AI financing is increasingly becoming a credit-quality concern, with rising contingent liabilities drawing greater scrutiny from rating agencies. Several major players are now seen moving closer to downgrade risk over the next two years. Big Tech has issued as much as $300 billion of residual-value guarantees over the past year, part of more than $3.1 trillion of off-balance-sheet commitments and credit support across major hyperscalers and chipmakers. These structures may keep liabilities away from the headline balance sheet and effectively ‘hide’ the exposure, they do not make the credit exposure disappear. While the credit in that sector remains strong overall, the timeline for the biggest players continuing to spend at these breakneck levels could start to shorten and that would knock out one of the largest supports for economic growth. Changing the designation of ‘artificial intelligence’ to ‘super intelligence’ by Trump will do nothing to change that risk!
As I pointed out last month, sentiment and investment behaviour suggest that everybody loves the stock market, but contracts show that everyone hates the bond market. For the contrarian investor the bond market is at least looking like a good hedge against stock market exposure. Surging budget deficits and debt issuance from the giant tech companies that used to generate massive free cash flows have pushed interest rates higher. We still believe that core inflation is still coming down and that economic growth is riding far too heavily on the ongoing data centre spending which, in combination, would begin to relieve the upward pressure on rates. Meanwhile, investors and hedge funds and speculators are all positioned for interest rates to continue higher with ‘net short’ positions on the U.S. 10-year bond at the highest level ever.We continue to believe that core inflation rates are coming down towards their targets and that there are really just a few substantial tailwinds for the economy that may not be sustainable. We believe that the consensus view that interest rates will continue to rise will not be achieved. Bottom line, it’s looking to us like a good time to have some Bonds in your portfolio (but perhaps not of the ‘James’ variety)!

1 2
Our investment management team is made up of engaged thought leaders. Get their latest commentary and stay informed of their frequent media interviews, all delivered to your inbox.