Keep connected
Our investment management team is made up of engaged thought leaders. Get their latest commentary and stay informed of their frequent media interviews, all delivered to your inbox.
John Zechner
June 4, 2024
Investors shrugged off the April downturn in stocks and got back on the buy side in May, once again putting to rest (for now) the old adage from the stock market almanac to ‘Sell in May and Go Away’. But the gains were incredibly narrow as investors once again focused almost solely on the Artificial Intelligence (AI) trade after another blowout quarter from chip-maker Nvidia and further spending commitments from its major customers, the hyper-scalers who are building out all these new data centers. The bullish narrative for the market earlier this year was driven by the belief that interest rates were going to be reduced multiple times this year and the ‘stock market bulls’ were getting excited that the rally was broadening out beyond the “Magnificent Seven” stocks, and how wider gains were a sign that the market’s rise was sustainable. Both narratives, though, have come to sharp ends in the past month as central bank rhetoric has clearly reinforced the ‘higher for longer’ mantra on the interest rate outlook at the same time as the broadening advance has once again narrowed and a brief burst of outperformance by smaller stocks seems to have petered out again. This past month, as indexes hit fresh records, just four giant technology stocks added more market value than the rest of the S&P500 put together, Nvidia, Microsoft, Apple and Alphabet added over $1.4 trillion between them in May. On top of that, over half of that gain came from just one company, chip maker Nvidia, which has been the runaway winner in the high-end graphics processing units used for AI. But even with all that growth ahead in data center builds, Nvidia will face more competition from well-funded customers such as Alphabet and Meta Platforms, a slew of startups, and traditional rivals such as Intel, AMD and Broadcomm trying to catch up. Even if they aren’t as effective, they should limit Nvidia’s ability to charge pretty much what it likes and therefore impede those gross margins which have exceeded 90% in recent quarters. Moreover, despite the massive build in data centers to host the massive migration of data needed for these large language learnings models, we expect the migration to software services from the AI build will be slower than market investors are pricing in right now. This also comes at a time when many enterprises have slowed their software spending due to overall economic uncertainty and stocks have not reacted well to any delays or other disappointments. Witness the 18% drop in the shares of software giant Salesforce after the cloud software vendor reported weaker-than-expected revenue and issued guidance that trailed Wall Street’s expectations or the 25% one-day plunge in shares of Workday. Both companies, as well as many other enterprise software vendors such as Snowflake, Intuit, Shopify, Adobe, Service Now, MongoDB and Open Text, have talked about how they were seeing their customers exhibit more budget scrutiny and longer deal cycles than usual.
On top of the ‘newly narrowing’ advance in stocks and weak earnings guidance in software as warnings signs for stock investors, we are also concerned about the fact that investor sentiment is simply ‘off the charts’. The CNN Fear-Greed index is well into “Greed” terrain. The Citi Panic/Euphoria index is back to being in “Euphoria” land. The Investors Intelligence survey is back to extremes, with the bull camp expanding to 59.4% and the bear share slipping to 17.2%. More than three bulls for every bear has only occurred in prior periods of uber-exuberance. The Bank of America Global Fund Manager Survey for May and was completely lopsided:
• Most bullish on equities since November 2021
• Cash ratios at a three-year low of 4%
• Stock allocations the highest since January 2022
As for the benchmarks for the stock market, it was just on May 17th that the champagne was being uncorked and ‘Dow 40,000’ hats were being passed out on the NYSE as the venerable price-weighted and highly economic-sensitive index closed above the 40,000 threshold for the first time. Here we are, less than two weeks later, and the Dow is down almost 2000 points (over 5%) from that all-time high. The slide has been so steep that the Dow has fallen back below its 50-day trendline. Rising uncertainty and greater downside risks are surely not compatible with a near-21x forward P/E multiple. This backdrop seems to call for continued caution about the outlook for stocks. However, while our cash levels have risen recently as we reduced positions in the cyclical and consumer sectors (autos, financials, metals, rails) we still see opportunities in many parts of the stock market where valuations already reflect recessionary conditions and/or the dividend yields and earnings resilience provide exceptional downside protection. Our most bullish point for stocks is that they are back to a position where “bad (economic) news is good (stock market) news” and we believe that we will get more bad economic news as the year progresses which will put further downward pressure on inflation and therefore interest rates. But the slowdown will not be severe enough to cause an overall fall in earnings, just a slowdown in growth versus the somewhat elevated expectations.
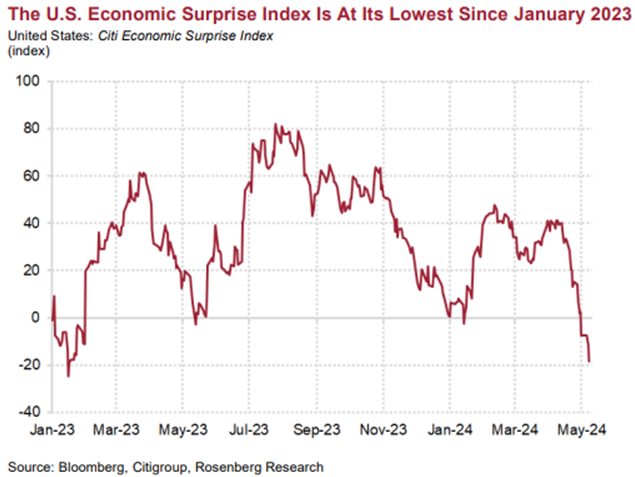
While the U.S. economy has proven to be far more resilient that we would have expected in the face of the substantial rise in interest rates in 2022-23, our dour outlook on the global economy has seen more U.S. data points added to the picture recently. U.S. banks reported renewed weakening in demand for industrial loans and a decline in household credit in the first quarter, the Senior Loan Officers survey showed. “Many consumers and businesses are feeling the pinch from reduced credit availability even as the Fed looks set to keep interest rates higher into 2025”, Nationwide said. The most recent Fed Beige Book comments reiterated that view as it was replete with emerging signs of economic weakness, a cooling labour market, receding wage growth, and significantly lower inflationary pressures. Quoting from the report; “Overall outlooks grew somewhat more pessimistic amid reports of rising uncertainty and greater downside risks.” “Hiring plans were mixed—a couple of Districts expect a continuation of modest job gains, while others noted a pullback in hiring expectations amid weaker business demand and reluctance due to the uncertain economic environment.” “Contacts in most Districts noted consumers pushed back against additional price increases, which led to smaller profit margins as input prices rose on average. Retail contacts reported offering discounts to entice customers.” “Price growth is expected to continue at a modest pace in the near term.” Consumer credit card delinquencies have risen in recent months and the overall picture is one of slowing growth, as demonstrated below in the chart of the U.S. Economic Surprise Index.
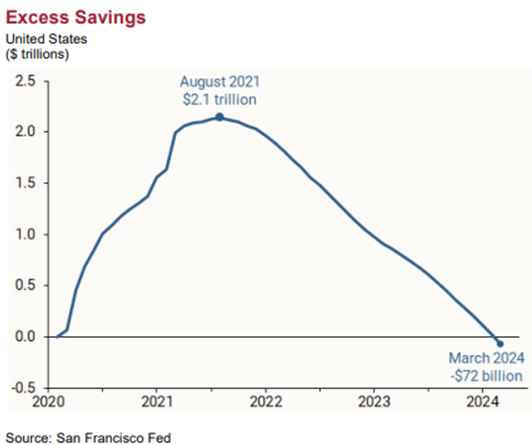
Consumer sentiment measures have also taken a hit recently. The University of Michigan Survey of Consumers Sentiment index for May posted an initial reading of 67.4 for the month, well off the consensus call for 76. The move represented a one-month decline of 12.7%. Along with the downbeat sentiment measure, the outlook for inflation across the one- and five-year horizons outlook jumped to 3.5%. We are seeing evidence of this slowdown in consumer spending in many core earnings reports from big sector names such as Uber, Starbucks, McDonalds, Air BnB, Disney, Expedia and retailers such as Target, Home Depot and Kohls. We also saw a drop in the ISM services index below 50, the demarcation line between expansion and contraction and to the lowest level since the early months of the pandemic. One reason that consumer sentiment has turned lower is that savings have been almost fully used up. The latest estimates of overall pandemic excess savings remaining in the U.S. economy have turned negative, suggesting that American households fully spent their pandemic-era savings. To maintain spending, consumers have tapped other valves like the credit card boom and now rely on “asset inflation” or the wealth effect for spending. The impact of this wealth effect should not be ignored. The U.S. stock market is valued at over 150% of national output (GDP). That is more than four times what is was in the 1980s and thus the impact of the substantial rise in stock prices we have seen since the late 2022 lows has been a huge tailwind for spending. That ability to access funding from these less liquid assets has been a cornerstone of the consumer backdrop for many months now and explains why the savings rate is near the floor at 3.2%. Spending based on economic and job growth is more reliable than spending funded by households ‘feeling wealthy’ like they have in this case due to seeing their “net worth” balloon nearly $12 trillion in just the past year. But, as seen in past cycles, this is unsustainable and can erode as quickly as it was created.
1 2
Our investment management team is made up of engaged thought leaders. Get their latest commentary and stay informed of their frequent media interviews, all delivered to your inbox.