Keep connected
Our investment management team is made up of engaged thought leaders. Get their latest commentary and stay informed of their frequent media interviews, all delivered to your inbox.
John Zechner
August 1, 2019
The other major factor fueling the strength in stocks this year has been the reversal in tone from the U.S. Fed from a tightening of monetary policy (or, more appropriately, a ‘move to neutral conditions’ from extremely easy conditions) to an active ‘easing bias’ in response to weakening global economic conditions and the risks from trade wars. While lower interest rates are automatically viewed as a bullish condition for stocks, investors should take a closer look to see if these lower rates are doing the job they’re supposed to be doing. Our concern is that the positive impact of lower interest rates (i.e. to encourage borrowing and increased spending) is wearing thin. The table below gives a basic snapshot of the last two global expansions. The 2001-2008 cycle (that ended with the Financial Crisis) was actually fairly normal as global debt expanded by 35% but the global economy actually grew by 75%. During the current cycle we have seen an explosion in debt to record levels, but only a 47% overall increase in global GDP. The clear message from the data is that this expansion has been more than fully-funded by debt. Record low interest rates have encouraged massive borrowing, but that has not been translated into corresponding increase in global economic growth.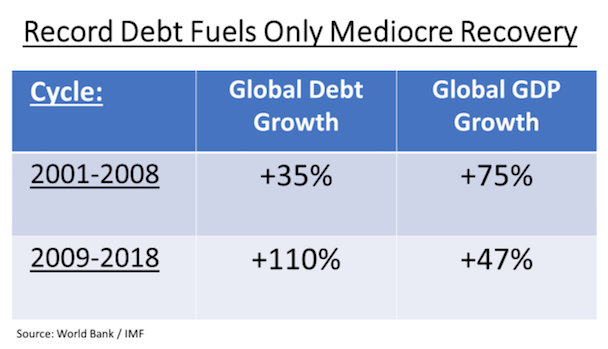
Stock markets have had a tremendous run-up over this period but over 75% of those gains have been due to higher valuations for stocks and only 25% due to actual earnings growth.
One of the workhorses of the current global expansion has been China. From their fiscal spending spree that lead the global economy out of the financial Crisis in 2008 to their continued buying of most global commodities, China has been the single largest source of global growth int eh past decade. Now investors are worried about the impact of the trade war with the U.S. on their economy. But trade tariffs are not the main problem for growth in China. The main structural drags on Chinese growth are homegrown. The hangovers from blistering stimulus binges launched since the 2008 financial crisis have sent debts skyrocketing to levels which now limit Beijing’s policy options. Total debt in China stands at over $40 trillion, or close to 310% of GDP. This represents an explosion from levels of just over 150% of GDP in 2008, revealing that much of China’s ‘golden decade’ was borrowed rather than bought. The frailty has forced Beijing to temper its ambitions. Officials routinely warn over the risks that could erupt from a vast, unregulated shadow finance system. Households are also increasingly maxed out. The upshot of all this is that Beijing no longer enjoys the luxury of being able to buy growth by deploying credit. Such limitations help explain why Beijing is reticent to return to the ‘go-go growth’ policies of 2009 and 2015. Slowing growth may push them back into some form of stimulus this year but the massive debts suggest it will be a limited, piecemeal affair. Investors should therefore not be counting on China to pull the global economy out of its current malaise this time around.
Another problem with the current stock market rally is that small caps are underperforming and, if history is any indication, it could be a warning sign for the broader market. The Russell2000, which tracks small-cap companies, is trading at its lowest relative performance to the S&P500 since the financial crisis. Importantly, this underperformance cannot be attributed to the risks from the trade war with China or the slowing global economy. The Russell2000 tends to be populated with more domestic U.S. companies that are less dependent on global trade or negatively impacted by the tariffs with China. Their lagging performance is mostly a “U.S. made’ problem.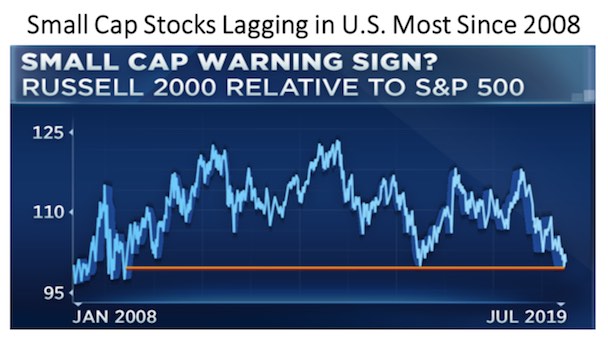
Corporations upping financial risk with continued buybacks. U.S. companies are on pace to break another record for share repurchases in 2019, using a combination of cash and debt to push the total to close to US$1 trillion. But are they taking more financial risk to achieve these stock supporting measures? For the first time since the financial crisis, companies have given back more to shareholders than they are making in cash net of capital expenditures and interest payments, or free cash flow. The level of buybacks to free cash flow hit 104% for the 12 months ending in the first quarter of 2019, the first time that number has topped 100% during the economic recovery that started in 2009. In 2017, the level was 82%. Over the past 12 months, nonfinancial companies have drained $272 billion in cash as part of the push to return still more money to shareholders. That represents a 15% decline and is the steepest drop since at least 1980. At the same time, corporate leverage continues to rise as gross debt outstanding has climbed 8% over the past 12 months. That has come during a rough time for corporate profits, with S&P500 earnings tracking for a 2.9% second-quarter decline, according to FactSet. Unless earnings growth accelerates materially, companies will likely continue to have to fund spending by drawing down cash balances and increasing leverage.
Our investment management team is made up of engaged thought leaders. Get their latest commentary and stay informed of their frequent media interviews, all delivered to your inbox.