Keep connected
Our investment management team is made up of engaged thought leaders. Get their latest commentary and stay informed of their frequent media interviews, all delivered to your inbox.
John Zechner
February 26, 2019
Global stocks and commodities continued to rally off the December lows in February as the ‘risk on’ trade is fully back in force. While even those with bearish views, such as ourselves, saw that stocks had gotten extremely oversold into the Christmas Eve lows (when we covered most of our short positions and went ‘net long’ the stock market for a short time), stocks have recovered well past our targets and we continue to be amazed at how strongly the market has re-surged from those lows. While the ‘technically oversold’ condition of the market on December 24th set it up for a trading bounce, a few more tailwinds added to the strength of the recovery and then it just started generating upside momentum. What has been even more surprising is how investors seem much more willing to overlook the growing list of negative economic and earnings releases and focus instead on an expected second half recovery in 2019.
A few factors have responsible for this significant burst of investor optimism. The most important change was when the U.S. Federal Reserve back-tracked on many of their late 2018 comments that had lead to market weakness, specifically saying that they would now be more ‘data dependant’ in terms of further interest rate increases and less automated on their plans to wind down the Fed’s balance sheet. Those comments resurrected investor belief that the Fed ‘had their backs covered’ when it came to financial market risk, much like they were from 2010-2017. When the U.S. central bank was raising interest rates throughout 2018, stock market investors were inevitably fighting an uphill battle as they knew it would lead to slower growth and lower stock valuations. Now, the Federal Reserve and virtually every other central bank appear to be keenly watching asset prices, given their increasingly tight connection to the real economy. That may not have been their stated intent, but that has been the effect of a marked shift away from restraint this year. This recent more ‘dovish’ policy tack by the Fed could be convincing investors that the run of economic weakness we are seeing right is indeed just a soft patch.
The other item that has fuelled bullish sentiment is the belief that the U.S. and China will soon settle their trade dispute. U.S. tariffs on over US$200 million of imports hurt global business confidence, growth and trade. President Trump pushed back on the planned increase in the rate of Chinese from 10% to 25% that was set to come into effect March 1st as a trade deal is still being negotiated with senior Chinese trade officials. Investors are once again seeing the glass as ‘half full’ and assuming that a deal with take place, tariffs will be removed and business confidence and spending will return. The ‘half empty’ view on a potential trade deal is that this is just another Trump tactic of ‘successfully ‘gaming’ the stock market’ by denigrating an existing deal and then claiming that a new deal is far superior, when the reality is something far less than that. This is what he did with the NAFTA renegotiations, European tariffs and even the political situation such as the rising North Korea nuclear proliferation risks in 2017 and the subsequent disarmament talks a year later, which have so far yielded no verifiable results. The benefits achieved on the ‘new NAFTA’ were no better for the U.S. than what they would have been by simply signing the Trans Pacific Trade Partnership. While, in the end, the U.S. and China may sign an MOU and China may agree to purchase substantially more American-made goods to reduce the annual trade deficit, there seems to be little chance that they can solve the larger issues of intellectual theft, technology transfers and China’s subsidies to domestic businesses.
While investors focus on the possible benefits of a trade deal and a more dovish Fed, the reality is that the economic news pointing to weaker days ahead continues to pile up. The global economy is in the process of rolling over from the 10-year recovery following the Financial Crisis in 2008. Some of the key signs we would point to include the OECD’s leading indicator falling for the 12th month in a row, putting it near its lowest in 10 years. The New York Fed’s ‘recession-odds’ model is at a 10-year high. Existing home sales dropped 19% in January, auto sales were down 17%, retail sales had their worst December since the last recession, housing starts dropped 7%, non-residential construction fell 6% and household employment dropped 250k in January even while the headline non-farm payroll number increased by 304k! Retail sales slid 1.2% in December, the biggest decline since September 2009. This was the worst sequential read for this metric since the early 2000s. In Canada, the slowdown also continues as the over-indebted consumer pulls back on spending in a period of higher interest rates. The chart below shows monthly retail sales data from the U.S. (left panel) and Canada. The December drop in the U.S. mirrors the declines seen prior to the last two recessions (2000 and 2008) while the Canadian data is even lower than what happened during the meltdown in oil prices back in 2015.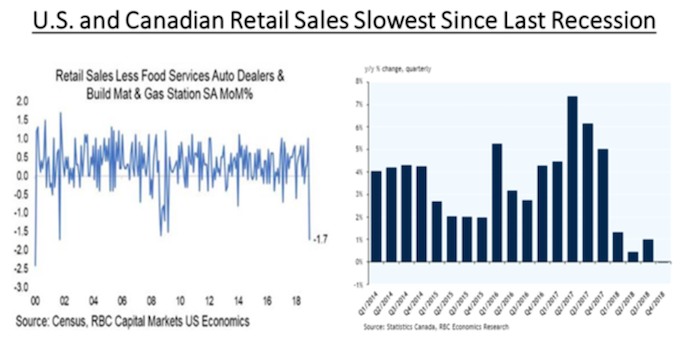
To be fair, many of the recent U.S. reports suffered from the impact of the 35-day government shutdown, so me might see some muted recovery in the next few months. The equity market collapse during the tail-end of the year would also have had an impact on spending as the S&P500 Index dropped more than 20% at the lows in a very short period of time and the uncertainty around the economic backdrop certainly could have also played a role. But the flow of weak numbers continues as core durable goods orders slumped in December, and were down in four of the past five months. Existing home sales also fell 1.2% in January, and have now fallen in 9 of the past 11 months. From a year ago, activity is off the most since the market was scratching its way out of recession in 2011. We could go on and on with these statistics, but the chart below shows a composite of all the data releases and the picture is not pretty! The aggregate surprise index of all data indicators compiled by Bloomberg has now slumped to the weakest (i.e., most disappointing) level since late 2015. This is a sharp turnabout from a few year ago. In the chart, the blue line shows the U.S. Economic Surprise Index while the red line is the S&P500 Index. While stocks have rallied sharply in the past two months, economic surprises have been weakening since the start of 2018!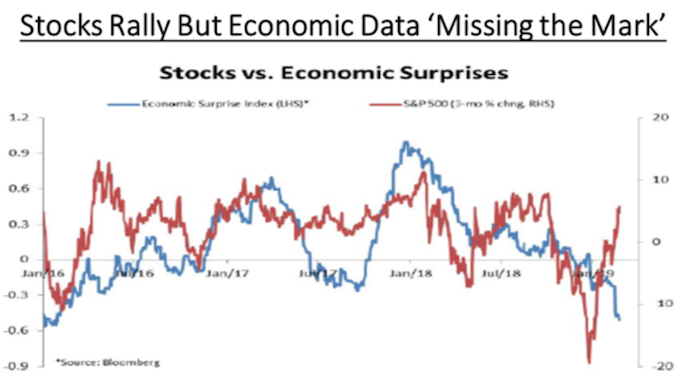
1 2
Our investment management team is made up of engaged thought leaders. Get their latest commentary and stay informed of their frequent media interviews, all delivered to your inbox.