Keep connected
Our investment management team is made up of engaged thought leaders. Get their latest commentary and stay informed of their frequent media interviews, all delivered to your inbox.
John Zechner
June 30, 2021
Stocks moved higher again in June to finish off a very strong second quarter and keep the bull market that began on March 23rd of last year intact. However, the substance of the recent rally was clearly different than what we’ve seen since last November. The value/cyclical/resource sectors have lead the stock market for most of this year, helping the Canadian market outpace the U.S. for only the second time in the past decade. But in the past month we have seen a return to the ‘high growth’ names, with the technology sector taking the lead once again, while financials, basic materials and industrials gave up big parts of their year-to-date gains. Oddly enough, this reversal in leadership took place even though the U.S. Federal Reserve, at their June meeting, acknowledged the recent strength in the U.S. economy, the rise in short-term inflationary pressures and ‘hinted’ that their first interest rate hikes might come earlier than 2023, as previously stated. Despite this slight increase in ‘hawkish’ views by the world’s most important central bank, bond prices rose as the 10-year government bond yield continuing to fall from its peak of 1.75% just two months ago to a recent low of 1.45%. The perplexing rally in bonds came at a time when inflation and economic growth each hit 13-year highs! So, while the ‘Fed’ was a bit more hawkish in their commentary after the meeting, they still support the notion of continued monetary ease on the premise that the current surge in inflation will be transitory and that employment levels remain far below ‘pre-pandemic’ levels and need to rise much further before this ‘easy money’ policy is reversed. Bottom line for now is that ‘the markets seem to be buying what the Fed is selling!’ The reversal in the past month to rising bond prices and a return to growth stocks seems to be indicative of a belief that economic growth may fade as stimulus slows down and the initial ‘pent up’ demand for goods and services soon gets satisfied. Bond prices also get support from the ongoing ‘quantitative easing’ program from the central bank, which has the Fed buying US$120 billion worth of treasure and mortgage securities every month just to maintain that financial ease. This support has ballooned the balance sheet of the Fed to over US$8 trillion, more than double what it was prior to the pandemic and almost a ten-fold increase from the level prior to the 2008 Financial Crisis!
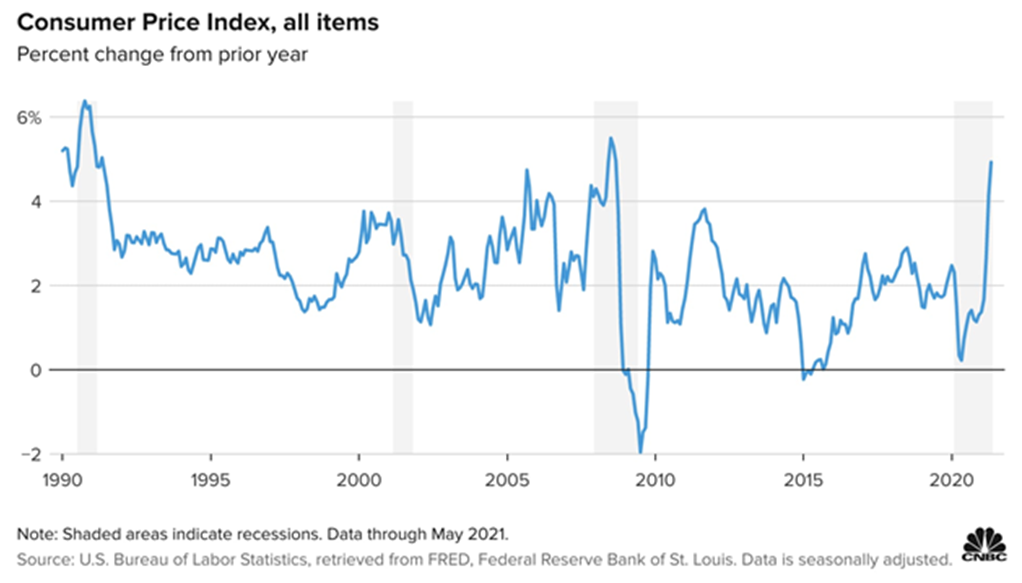
While markets seem to be buying into this idea that inflation will be ‘transitory’ (without really explaining how long ‘transitory’ is) we expect that supply chain distortions, growing demand from the re-opening and an underinvestment in commodities and infrastructure over the past decade will keep cyclical inflationary pressures in place longer than investors might expect. The chart below shows the path of the Consumer Price Index (CPI) over the past three decades. The Fed seems to be betting that the CPI will recede from these levels as it did during prior recoveries in 1991 and 2010. But we believe that the distortions to global supply chains from the pandemic, the growing tightness of the skilled labour market and the underinvestment in facilities and structures over the past decade will all work to keep price pressures ‘stronger for longer.’ While some key commodities such as lumber, corn and copper have checked back from recent highs, most companies we have heard from still see goods shortages, longer delivery times and very tight inventory levels, all of which point to continued high levels of overall inflation. Just looked at used car prices!
On this view that inflation will remain elevated for longer than most investors expect and that this resurgent growth will be sustained through 2022, we have been adding to cyclical exposure on recent weakness, particularly in the U.S. financials, Canadian energy, basic materials and industrials. Our target weight for these sectors in our stock portfolios is 60-70%. However, the longer-term trend toward disinflation from globalization and increased technology remains in place, which argues for continuing to hold 20-30% of stocks in large cap growth stocks with reasonable valuations in health care, technology and telecom. We remain overweight preferred shares as slightly higher interest rates and stronger credit conditions fuel buying in that asset class, but are underweight bonds where we see little, if any, absolute return potential and would rather just hold cash as a hedge against any market volatility and look for buying opportunities if any weakness occurs in stocks
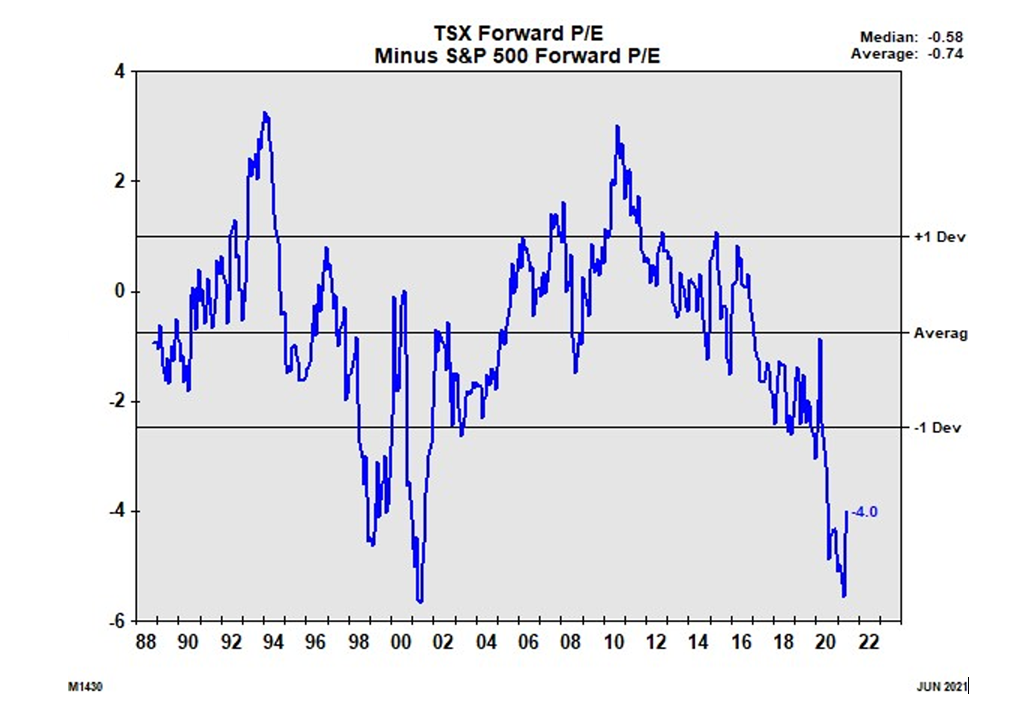
This strategy of focusing on the more economically-sensitive stock sectors does push us towards a higher weight in the Canadian market in our North American asset mix. Not only does the Canadian index have a higher weight in basic materials, energy and financials than comparable U.S. indices, but the valuations in the Canadian market are well below those of the U.S., as shown in the chart below, which compares the forward price earnings ratio (P-E) of the TSX Composite Index to the S&P500 over the past three decades. Markets today look a lot like they did following the ‘bursting of the technology bubble’ in 2000. After that, as global growth surged over the following decade, Canadian stock valuations closed the gap, right up until the Financial Crisis in 2008. After that, a decade of slow economic growth and continually falling interest rates helped growth stocks outperform the cyclicals for most of that period.
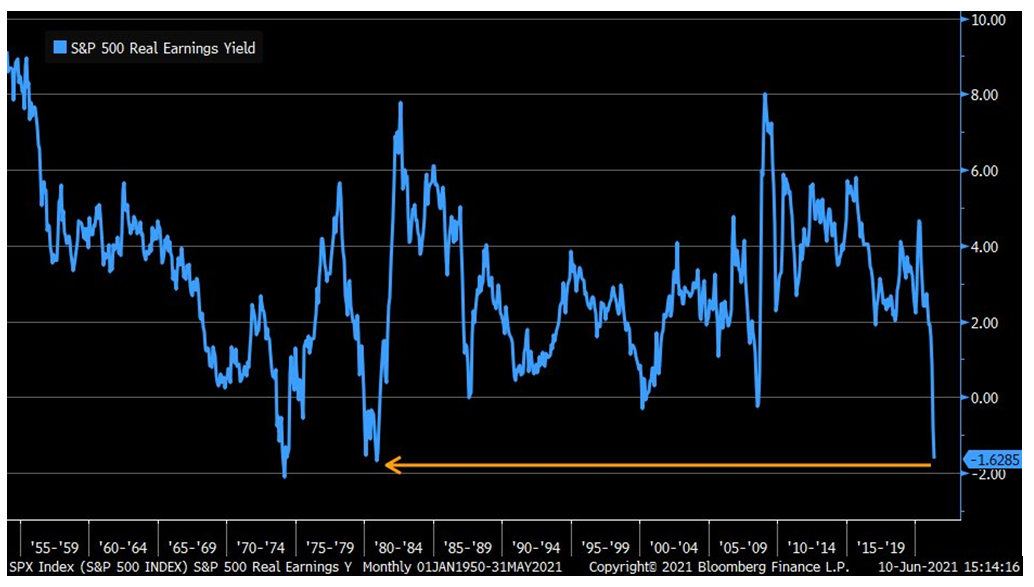
Of course, ‘cheaper stocks’ is only applicable on a relative basis. The simple reality about stock markets everywhere right now is that, by almost all valuation methods, they are priced at stratospheric levels such as we have not seen since the end of the ‘tech bubble’ back in 2000, or even earlier than that for some measures. Whether its price earnings ratios, cash flow multiples or total ‘market capitalization to GDP ratio (a Warren Buffet favourite), the levels at which stocks are trading right now is extremely elevated, even after taking into account the fact that interest rates remain near all-time low and therefore more supportive of higher valuations. The massive fiscal and monetary stimulus of the past year along with optimism about the re-opening of the economy and a wave of new retail entrants into the world of stock market investing all magnify the downside risks should we start to see any break in the momentum that has carried stocks higher for the past fifteen months. Rising inflation is also a risk for stock market valuations since it forces nominal interest rates to rise and undercuts the ‘there is no alternative to stocks’ mantra that has driven much of the buying. To put all of this in a more visual perspective, have a look at the chart below, which shows the ‘real earnings yield on the S&P500’ over the last 65 years. This is basically aggregate earnings adjusted for inflation divided by the value of the S&P500 stock index, thus expressing stock market valuation in terms similar to those used to measure returns on cash or bonds. What is readily apparent is that the real yield on U.S. stocks has not been this low since the early 1980s.
This, in and of itself, is not a reason to go out tomorrow and sell all your stocks, particularly since earnings are currently experiencing a very sharp recovery. It does, however, highlight the risks that investors could face if earnings growth slows down or interest rates start to rise. It does suggest a more conservative stock portfolio with some dividend protection, lower valuations and more immediate profit growth.
1 2
Our investment management team is made up of engaged thought leaders. Get their latest commentary and stay informed of their frequent media interviews, all delivered to your inbox.