Keep connected
Our investment management team is made up of engaged thought leaders. Get their latest commentary and stay informed of their frequent media interviews, all delivered to your inbox.
John Zechner
December 27, 2019
Stocks rallied into year end on renewed optimism about a ‘Phase One’ US/China trade deal, less risk of an economic downturn in 2020 and continued support from global central bankers. The advance has come on very low volume, suggesting that it is being driven by a lack of sellers as opposed to a new wave of buying. Investors are most likely loathe to take profits and pay the capital gains taxes this year, while many managers like to show a more fully-invested portfolio at year end and don’t want to be seen as selling too early in a rising market. Not to try to ‘rain on this parade’, but the more skeptical among us (including a weekend article from Bloomberg Business) point out that “never before have we seen such a rally in risk assets so devoid of fundamentals and built on such leverage.” The 2019 stock market rally has been driven entirely by increased valuation as stocks as opposed to earnings growth, which was basically non-existent. Like much of the past decade, once again the gains were supported by excessively ‘easy’ money conditions, particularly in the U.S. where the Fed has once again been on a tear with the re-expansion of their balance sheet and a 10% annualized expansion in the money supply in the last quarter. Given that economic growth has been slowing along with real business spending and the demand for loans, the excess liquidity created by these central banks has nowhere to go except into financial assets. This is very apparent when looking at commercial bank balance sheets, where their holdings of U.S. treasury securities has risen by over 17% this year. The investing public is also buying into the euphoria, as evidenced by the most recent survey of AAII (44% bulls from American Association of Individual Investors) as are investment advisors. Investors Intelligence Survey has gone from 5% net bearish one year ago (30% bulls/35% bears) to 40% net bullish today (57% bulls/17% bears). Stock investors are less prepared for a downturn when it finally does arrive. Cash levels are at record lows in both private client accounts as well as institutional and mutual funds. The bottom line on market sentiment is that the CNN Fear-Greed Index (range of 0-100) now stands at over 90, versus under 10 one year ago. Meanwhile, the VIX Index, the traditional measure of investor complacency, sits near an all-time low. This bull market might continue to surprise us on the upside, but all of the typical signposts we’ve seen at the end of any prior market cycles seem to be firmly in place.
Households in the U.S. have been pulling money out of stock funds in the past few year (to the tune of over US$135 billion). Stock bulls have pointed to this behavior as supporting further gains since the investing public has a bad habit of selling at the bottom and buying at the top and will still see the market post further gains as public investors come ‘storming in’. What that analysis fails to account for, though, is the fact that the gains in stock prices in the past decade have already pushed household wealth held in stocks to its highest level (69%) since the market peak back in 2007. That percentage (at 67%) was itself a new record, surpassing the prior peak of 61% back in 2000, once at a stock market peak. Are we seeing a recurring theme here? Once investor holdings of stocks hit cycle or record highs, then the ‘writing is on the wall’ for the end of that cycle. The fact that public investors have been net sellers of stocks this year is probably nothing more than some normal ‘rebalancing’ of holdings.
We also see too much optimism about economic growth that has supported this stock market ‘melt up’. While many strategists are now saying that recession risk has been avoided due to recent overseas recoveries, the potential lessening of trade tensions between the U.S. and China as well as some better domestic data, we still see classic sign of risk for next year and expect lower growth and a further decline in profits.
Is the Recent Bounce in Commodity Stocks for Real? We have seen a recovery in the past month in many energy and metals stocks in Canada, which had been under significant selling pressure for much of the past few years. Bulls have attributed it to more optimism that we have seen the worst of the economic downturn, with some stronger data coming out China and Europe as well as the reduction in trade tension with the expected signing of the Phase One trade deal. We attribute the recovery to some other factors; the end of tax loss selling in Canada has removed one overhang in an illiquid market where buyers had been overwhelmed by foreign selling as well as local. We have also seen some more supply restraint in key commodity markets such as copper and oil, which has allowed for further price strength. Most importantly though, we expect that a bottoming of growth in Europe and Asia, combined with a slowing in US growth will combine to bring some weakness in the US dollar. This is the biggest potential upside for value/commodity sectors and could allow for some further growth in those oversold sectors, which have suffered from severe neglect as investors chased valuations higher in the growth sectors of the market. Although we would temper this optimism due to our less bullish economic outlook, we continue to have positions in mid-sized stocks in the energy and base metals sectors as well as an overweight position in gold stocks. The chart below is the type of market indicator we like to see, a 50-year look at the relative performance of stock versus commodities. It clearly shows commodities trading at the largest discount in 50 years, including the low levels that occurred at the end of the ‘technology bubble’ in 2000. It is reminiscent of the types of long-term charts we saw favouring stocks at the market lows back in 2009.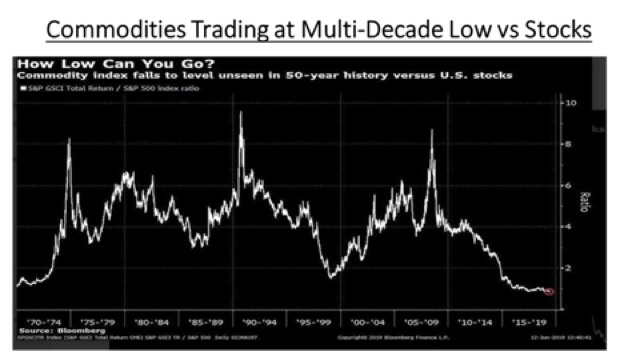
But we don’t see any commodity rally being driven by the same factors as those a decade ago, which were the massive debt-financed capital spending initiative put on by China, which lead to a huge increase in the demand for basic materials such as iron ore, steel, lumber, copper and oil. While recent Chinese industrial growth rose to a five-month high on strong production of heavy industrial products such as steel and cement, this looks unlikely to last. The value of infrastructure projects approved by China’s economic planning agency jumped in the second and third quarters, but has cratered since September as fiscal constraints bite. Strong infrastructure-driven demand for materials could last a few more months as that effect feeds through with a lag, but probably no more. China’s power sector is already heavily over-invested. China’s housing market—the most important driver of global metal demand—is also starting to look shaky again. Property investment growth slowed and new home prices rose half as fast as last year. China’s growth slowdown is for real and will continue!
1 2
Our investment management team is made up of engaged thought leaders. Get their latest commentary and stay informed of their frequent media interviews, all delivered to your inbox.