Keep connected
Our investment management team is made up of engaged thought leaders. Get their latest commentary and stay informed of their frequent media interviews, all delivered to your inbox.
John Zechner
May 1, 2018
What is the data we are seeing now that makes us believe that we are very late in the economic cycle? The chart below shows two very telling indicators that have fore-shadowed coming recessions very well in the past; the shape of the yield curve and the unemployment rate. The shape of the yield curve is a measure of the difference in the yield levels of 2-year and 10-year government paper. Prior to every recession (grey areas on the chart) the yield curve has become negative, meaning that 2-year yields rise above 10-year yields as shorter-term rates are pushed higher to ward off growing inflationary pressures that occur late in the economic cycle. While the yield curve (blue line in the chart) has not yet turned negative in the U.S., it has fallen from almost 250 basis points four years ago to only 50 basis points today, and it is expected to continue to fall as the U.S. Fed raised short-term interest rates further. The other indicator is the unemployment rate (red line in the chart). As the rate falls, wage pressures start to increase, which inevitably leads to higher interest rates and a choking off of late cycle growth. This has occurred in every economic cycle dating back to the 1950s and we can see that the UE rate is once more down to those critical levels.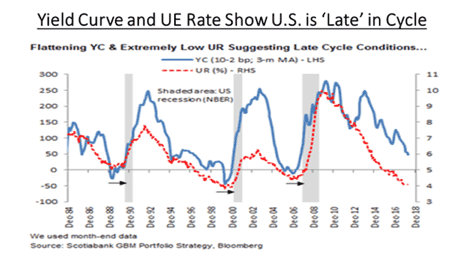
While neither indicator is at recession levels yet, the direction for both is clear. Economic growth is on the verge of slowing down and the current economic cycle, which is close to the longest on record, is on its final legs.
We are already seeing signs that growth is starting to slow in some larger developed markets. The EU Commission’s Economic Sentiment Indicator (ESI) was the latest euro area survey to post a larger-than-expected fall for March. The ESI fell to 112.6 from 114.2 in February, falling for a third successive month after peaking at 115.3 in December. The fall from the ESI’s December highs has been reflected across the four main euro area economies with sentiment declining in Germany, France, Italy and Spain over the same period. While the moderation in the U.S. has so far been relatively small, with the Citi data surprise indicator still positive, recent indicators in Europe suggest that growth has slowed substantially more than market expectations. This is likely to in part reflect the impact of a stronger Euro.
Another area where we have growth concerns is China. While expected growth this year is in the 6.5-7.0% range, we believe there is more downside momentum building as that economy will lose some momentum due to slower European growth as well as potential downside if the U.S. goes ahead with their announced trade tariffs. The housing and construction market also has pulled back in the past year as the government tries to deal with an overbuilt market. In fact, the Chinese economy has had some struggles with overall growth for some time now but had been using rapid credit expansion to fuel further growth. This stimulus seems to be coming to an end as seen in the chart below which shows the growth rate of various measures of credit in China. The debt binge that fueled Chinese growth in 2015-17 has reversed and actually gone negative in the past year as Chinese banks begin to deal with record debt levels.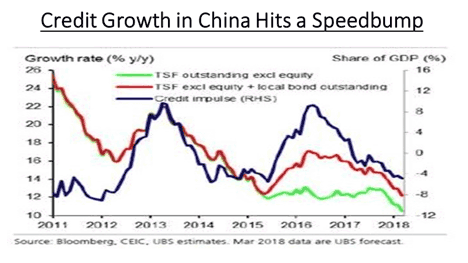
This of course leads us to a bigger issue; will record debt levels finally make a difference in financial markets? Global debt hit its highest levels ever and governments should take actions to reduce their indebtedness while the going is still good, according to the International Monetary Fund (IMF). Total debt levels globally came in at a record $164 trillion in 2016, amounting to 225% of the world economy’s gross domestic product, according to the IMF’s April Fiscal Monitor. That level of debt was 12 percentage points steeper than the last historic high seen in 2009 immediately after the global financial crisis. The United States is the only country where the public debt-to-GDP ratio is forecast to go up, from 108% of GDP in 2017 to 117% in 2023, mainly due to the spending plan passed by Congress and recent tax cuts. The Congressional Budget Office (CBO) in the U.S. forecasts a $1 trillion-plus deficit for fiscal 2020, even with bullish economic assumptions that the economy will grow 3.3% this year and 3.3% in fiscal year 2019. Those predictions are more optimistic most private-sector forecasters or the Federal Reserve. Taken as a percentage of gross domestic product, the annual deficit is expected to run at 4% this year, up from 3.5% in fiscal 2017, and rise to 4.6% in fiscal 2019. The CBO sees the shortfall peaking at 5.4% of GDP in fiscal 2022 and levelling off at about 5% after fiscal 2023. To put that number in perspective, the United Kingdom was forced to seek a loan from the IMF in 1976, when its debt-to-GDP was just over 50%! The key difference was in the currency; the run on sterling pushed up inflation and interest rates, forcing the need for the IMF bailout. While the U.S. continues to enjoy strong dollar flows due to its perceived ‘safety’ and the fact that interest rates have been rising, investors have to be concerned with all the rhetoric around trade lately and the fact that both Japan and China each hold over US$1 trillion of U.S. treasury bonds and their continued buying is necessary to fund growing deficits in the U.S. It’s probably not a good time for President Trump to be picking trade fights with its biggest creditors!
Our investment management team is made up of engaged thought leaders. Get their latest commentary and stay informed of their frequent media interviews, all delivered to your inbox.