Keep connected
Our investment management team is made up of engaged thought leaders. Get their latest commentary and stay informed of their frequent media interviews, all delivered to your inbox.
John Zechner
February 5, 2020
Stocks charged out of the starting gate to start 2020, following on the momentum of the fourth quarter of last year, with a focus on the cyclical stock sectors and a recovery in commodities based on more optimistic views about global growth in 2020. While we were skeptical about the economic optimism, all of that became a moot point when the Coronavirus epidemic in China began to take over the headlines in mid-January. Bond yields showed the biggest initial reaction, with U.S. Treasury yields slipping down to below 1.5% briefly, from almost 2% earlier in the month. Asian and European stocks also had a more negative immediate reaction, since the epicenter of the virus was in China and those economies are most impacted by a potential slowdown there. The U.S. stock market has held in relatively well since money flows were still strong into the growth sectors and investors also seem to believe that central banks will once again come to the rescue if growth sputters. But cyclical and resource stocks clearly took the largest sectoral hits with investors worried that limiting movement in China would not only slow down spending in the world’s second largest and fastest growing economy, but it would also disrupt the global manufacturing supply chains that are centered in that economy. Commodities were knocked sharply lower on those growth fears with the CRB Commodity Index dropping 8.2% in January, lead by double-digit percentage losses in the oil and copper markets. Energy and base metal stocks were the biggest losers with losses similar to those of the underlying commodities.
In terms of the Corona Virus and it impact on the markets, we hear many comparisons to the SARS outbreak in 2003, which lead to a short-lived fall in stock prices and very little impact to global economic growth. We differ on that view and see this as more reminiscent of the Fukushima crisis in 2011 in terms of potential stock market and economic impact. Here again we have effectively seen a shutdown of the world’s 2nd largest economy (Japan was in that position in 2011) but one which has been responsible for most of global growth and trade over the past decade. With 60% of China’s population now in urban areas, compared to 60% rural in 2003, and passenger journeys by air increasing from 80 million to 660 million, the cost of shutting down huge cities has not been properly priced in. It’s not just that production facilities have been shuttered, flights cancelled and travel activity sharply curtailed, but the big and enduring macro risk is that the fear of infection is likely to keep many people at home long after this crisis ends. Stock markets appear to be minimizing these risks at this time.
The global economic impact will also be larger since China not only commands a much higher share of global output than it did during the 2003 SARS scare (19% now versus 9% then), but the consumer in China accounts for a much larger share of their own GDP as well (accounting now for half of the aggregate growth in the economy), compounding the hit to the overall global economy. The potential fallout could also be worse now because growth is in a danger zone. Big shocks for weak economies that don’t have cushions to withstand them could lead to unexpected recessions. In 2011, the market impact was a cyclical bear market as stocks dropped by over 20%, while gold and bond prices rallied. Cyclical and resource stocks took by far the largest downward hits in that period, but it should be noted that it also coincided with Greek financial crisis and was hence made even worse. Investors appear to be assuming that this risk will pass quickly but we continue to be wary of the risk.
Despite this overall stock market bullishness, we continue to see economic data that makes us wary about the economic optimism. A plethora of weaker economic data points undermines our belief that the global economy faces a pullback in growth. U.S. core capital goods orders recorded their largest drop in eight months with business investment contracting further in the 4th quarter, reducing economic growth prospects going forward. Total business expenditure contracted at a 1.5% annual rate in the fourth quarter, the third sequential decline and something not seen since the Great Recession. Spending on machinery and equipment was down by 2.9% and non-residential construction collapsed at a 1.5% annualized pace. The bottom line is that the recession in the business sector is ongoing. European numbers are also showing some cracks. While the recent ISM surveys did show some rebound, growth in the Euro-zone remains mired in the 1% range. Also, surveys are just that and are often influenced by market factors as are the confidence numbers. Maybe businesses are just expressing optimism because they’re gazing at their inflated stock prices. But consumers don’t seem to be taking the bait, as Euro area households continue to cut their spending with retail sales activity down by a hefty 1.6% in December alone. Most importantly, all of these weak economic readings are before the onset of the coronavirus. Those numbers will only worsen going forward.
As the earnings season began to take hold in late January, we noticed more earnings and revenue ‘misses’ as well as reductions in outlook than we have seen for a few years. Global behemoth 3M forecast 2020 profit below estimates on weak China demand, Harley-Davidson’s saw its shares skid on steeper revenue drop and Facebook stock fell 8% after it reported fourth-quarter that showed a higher cost structure. Clearly there have been winners too with tech giants Microsoft, Amazon and Intel all bucking the trend of slower global growth as they benefitted from the continued migration to ‘cloud computing.’ Overall earnings growth is on track to be down slightly on a year-over-year basis for the third time in the last five quarters. Our bigger concern, though, is that this meagre growth from headline earnings are a clear overstatement of actual profitability. Share buybacks and mergers have helped profit growth at largest companies in the S&P500, but the National Accounts measure of net income actually peaked back in 2015 and has been in overall decline since that time. That measure includes all the non-public and small companies in the database and is a much better measure of the profits available to fund employment growth and expansion.
Adding to our concern about the stock market is the fact that the bulk of the gains over both the past year and the past decade have been due to expansions of earnings multiples as opposed to earnings growth. As shown in the chart below, over 90% of the gain in stock prices last year was due to a higher multiple on stocks as opposed to any real earnings growth. Clearly that was due to the much more ‘dovish’ reversal on interest rates by the U.S. Federal Reserve in early January last year, there has to be a limit to how far stocks can rise simply on higher valuation alone! This has been the case for the bulk of this bull market over the past decade. While earnings growth accounted for over 60% of the gains over the prior decade, the bulk of that growth came in the first few years of the decade when earnings were recovering from the sharp declines that came from the Financial Crisis in 2008.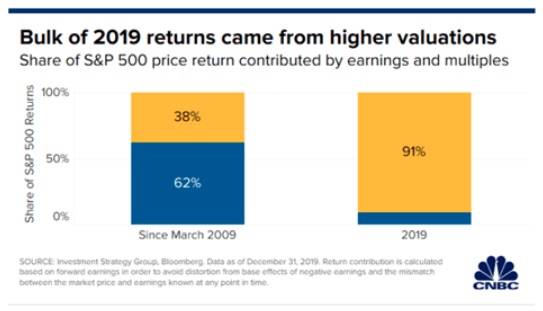
In the single stock stories in the stock market, Tesla has been the poster child for the latest bout of speculative and momentum-based investor behavior. The ascent for shares of the electric-vehicle maker are near-parabolic and the unabashed run-up in recent days has some investors comparing the jump to bitcoin’s surge back in 2017, as the chart truly looks insane and a lot like Bitcoin did during its mostly bullish period. While Tesla’s gains have been predicated partly on more bullish calls from analysts and better quarterly results from the vehicle maker, the valuation and market cap at over $150 billion is some significantly higher than GM, Ford and Fiat Chrysler combined. Investors are clearly looking beyond any traditional measures of valuation. Like Bitcoin was viewed as ‘the future of money,’ the valuation of Tesla is clearly signalling that it is viewed as being ‘the future of automobliles.’ While that may end up being true, it will take many, many years for that scenario to play out and, like Bitcoin, investors should be prepared for much volatility along the way.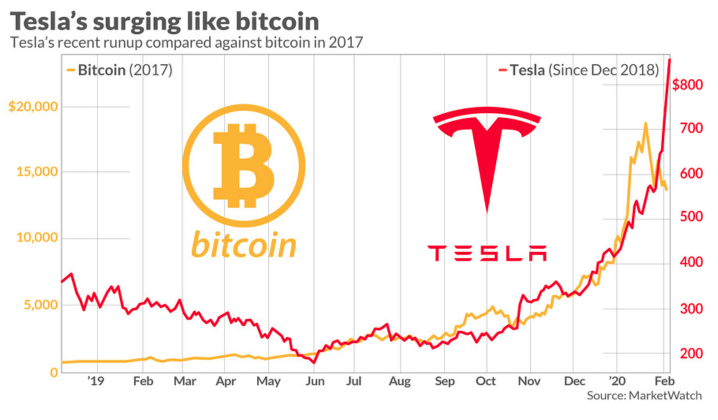
1 2
Our investment management team is made up of engaged thought leaders. Get their latest commentary and stay informed of their frequent media interviews, all delivered to your inbox.