Keep connected
Our investment management team is made up of engaged thought leaders. Get their latest commentary and stay informed of their frequent media interviews, all delivered to your inbox.
John Zechner
September 28, 2020
Mark Twain famously wrote the title phrase but then Twain further observed that “July, January, September, April, November, May, March, June, December, August, and February were other dangerous months to be in the market.” What was said about October has been especially true in U.S. presidential-election years, the Stock Trader’s Almanac finds. What history actually shows is that September is the worst month for markets, not only because investors are probably looking a little more seriously at the data than they would have over the slower summer months, but also because it often happens that fourth quarter begins to show that investor expectations for earnings and growth for the year had been too optimistic and that time is running out to correct those shortfalls. This year has really been no different despite pandemic-related volatility. After technology stocks lead the market to record, ebullient highs in August, realities seem to set in this past month and stocks shed many of those gains.
In August we lightened up on equities overall by selling most of our technology and other high growth sectors as well as some interest sensitive names (i.e. utilities/pipelines/telecom). September saw the first good rally in the value sector but extreme weakness in growth. Given the predominance of growth in the major US indices, markets have fallen sharply in September. Towards month end we started adding back to positions on the market weakness, but all of our new buys have been focused in ‘value’ sectors such as industrials, financials and basic materials. Even in the tech sector we have only stuck with the more ‘output oriented’ group, the semi-conductors. Our overall premise is that we have seen the worst of the economic news for this cycle. It’s not a matter of ‘if we recover’ but more ‘at what pace do we recover’ and is that strong enough to drive enough profitability to sustain extended stock market valuations? Clearly there is no lack of risks in front of all investors, including the upcoming U.S. elections, the developing second wave of Covid-19, the lack of any new stimulus spending, the massive level of global debt and the excessive levels of speculation we have seen on some growth stocks by short-term traders. On top of that, valuations are as stretched to the upside as they have been basically at any time outside of the technology bubble in the late 1990s, and we all know how that ended!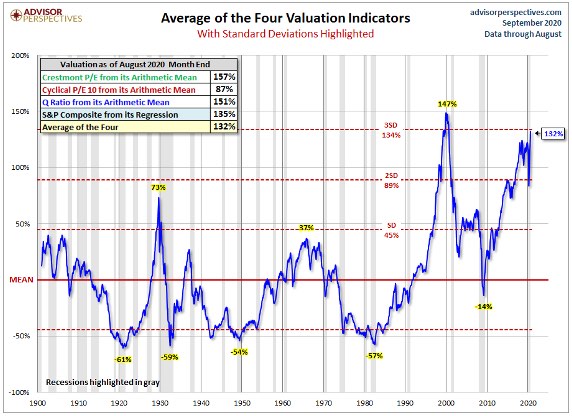
But none of the afore-mentioned risks are unknown or misunderstood such that investors may have gotten too defensive to account for those risks. Uninvested cash remains near record levels in an environment where cash is just not a profitable option. It all adds up to a major dilemma for most investors.
In this type of higher risk environment, within our managed portfolios we are always looking for areas where we tend to see ‘asymmetric risks’, that is where the risk-adjusted upside for a security is much higher than the risk-adjusted downside. One clear area where we see that right now is in the difference in valuations between the high growth sectors of the market versus the traditional ‘economic sensitive or ‘value’ sector stocks. Low-ROE and non-earning stocks have dominated the Russell2000’s rebound since late March, as investors focused on revenue growth above all else. That has benefited a lot of software, biotech, and other stocks, but forced investors to pay up for earnings, if they exist at all. This was fueled in large part by the aggressive actions of central banks in reducing borrowing costs to near zero, effectively creating free money in the process which was funneled into financial assets, particularly at the higher risk end of the curve. Those high growth stocks are now more expensive than they’ve been since the technology bubble of the late 1990s. The fastest sales growth names in the Russell2000 sell for 4.1 times revenue—in the 93rd percentile historically—versus below one time sales for the weakest growers, 18% below the long-term average. The price-to-forward earnings ratio of the Russell 1000 Growth index recently hit 31 times, while its Value equivalent trades for 19 times. Growth investing trounced value for much of the past decade, and growth stocks’ lead widened this year as the market rebounded. This is not a new trend as well, noting that ‘growth investing’ has trounced value for much of the past decade as interest rates have collapsed to all-time lows. This divergence was logical since growth stocks are valued by discounting their anticipated future cash flows to derive a ‘present value.’ As interest rates fall, the present values of these discounted cash flow increases. Meanwhile, the fact that the economic expansion of the past ten years has been much slower than any past recovery has meant slower earnings growth for the economic sensitive sectors of the stock market. This lead has only widened this year as the market rebound was driven by even lower interest rates for a longer period of time and a migration to many of the growth stocks that personified the ‘work from home’ shift.
However, in the past month, we started to see a bit of a change in leadership from those extended growth sector to some of the value laggards including the financials, industrials and even the energy sector. As industrial growth continues to come back on a global basis, we expect this shift to continue for the remainder of 2020 and beyond. When leadership last shifted from growth to value in 2000, it began an eight-year run that culminated with the Financial Crisis in 2008. Economically sensitive stocks are looking like a good bet for investors with at least a medium-term time horizon and a belief that this virus will be brought under control and a vaccine developed at some point over the next year. While all activity will probably never return to the way it was prior to the pandemic, much like flying was never the same after 9/11, we don’t see the extreme economic conditions remaining in place indefinitely.
On a separate note, we find it interesting to talk about the recent prognostications from the U.S. Federal Reserve, stating unequivocally that they will be keeping interest rates at these extremely low levels right through 2023! It seems hard to believe, with all the unknowns faced in the economy, inflation and markets, that the Fed could come out and say they will hold interest rates near zero for the next three years. Who can possibly project forward so far in these conditions? Did anyone even imagine what we would have gone through in the past eight months at the beginning of this year? Clearly they are just trying once again to give comfort to financial markets and refuse to see the asset bubble they have been creating with this easy money policy. While no one seems to be worries about inflation right now, we have never seen the type of monetary expansion on a global basis as we have in the past decade. Only in South America in the 1970s and some African countries in the 1980s have we seen such massive monetary stimulus. In all of those other cases, the currencies ended up collapsing and inflation soared well above 100% annual rates! If we turn around three years from now and find that inflation is running at 4-5% due to all the monetary stimulus and the economy is growing at 2.5%, there is no chance that interest rates would still be at zero? That’s another reason to keep some of your portfolio invested in gold/precious metals. As for the central bankers such as the ‘Fed’, they should just go back to their old standard line of saying that their policies will be “data dependent”
We also see owning bonds as an area of asymmetric risk against you. It’s not because we’re confident bond yields are going to go up; it’s because there’s some risk they might go up, and there’s very little scope they might go down. In our Hedge Fund, we have recently begun short-selling the long term US Treasury ETF (TLT). If long-term rates actually fall back below 1%, we would lose about 4% on this position, but if they go back above 2%, it would yield a gain of over 15% on that same position. With all the deficit spending and debt accumulation we see more of a chance for higher inflation and higher longer-term interest rates to attract the necessary capital to fund those shortfalls which will put upward pressure on rates. But forget about all those arguments for now and simply look at the chart below, which shows yield on 10-year U.S. government bonds over the past 55 years. Making the simple assumption that interest rates will not go negative (given the complete failure of negative interest rates as an investment policy in Japan since the 1990s and Europe since 2010), it’s hard to look at that chart and not have some concern that interest rates will have to reverse to the upside, even if they remain at extremely low levels.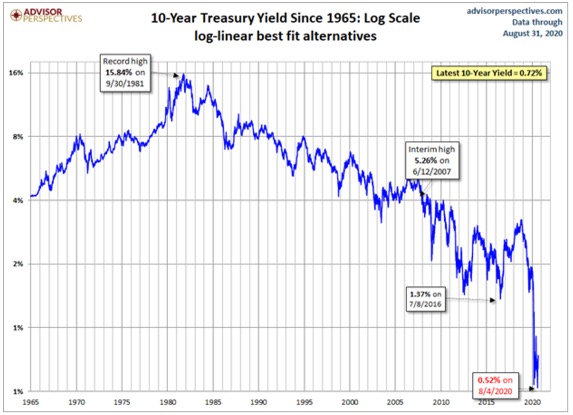
1 2
Our investment management team is made up of engaged thought leaders. Get their latest commentary and stay informed of their frequent media interviews, all delivered to your inbox.