Keep connected
Our investment management team is made up of engaged thought leaders. Get their latest commentary and stay informed of their frequent media interviews, all delivered to your inbox.
John Zechner
March 27, 2018
The volatility in the stock market that finally arrived in early February continued into March as stocks sold off early in the month, then continued their rally off the Feb. 8th lows before faltering again to the February lows and finally bouncing back a bit on the last four days of the month. The net result was still a down month for stocks, primarily due to weakness caused by trade war fears as well as a more ‘hawkish’ outlook than expected from the new U.S. Federal Reserve Chief Jerome Powell during his ‘post-meeting’ press conference. The Federal Reserve Board raised their expectations for the number of rate hikes in 2019 and the Trump administration, while battling another round of defections and firings in the West Wing, announced their decision to levy tariffs of 25% on imported steel and 10% on imported aluminum. Then, realizing that those tariffs didn’t really reach their ultimate target, announced tariffs on about $60 billion worth of Chinese goods. On top of that, there were some concerns about slowing economic growth as ISM surveys were weaker and data on retail sales came in below expectations despite the recent tax cuts. Adding to the recent stock market woes was a breakdown in some of the key FAANG stocks, lead by Facebook (FB). Its failure to protect customer data shaved 14% off its stock price in one week, contributing to the S&P500 Info Tech Index’s 7.9% slump.
We still see problems in the stock market despite the rebound off the February and March lows. The ‘technical quality’ of this recovery has been very suspect as we have seen declining breadth, with over 80% of the S&P500 stocks still trading below their 50-day moving averages. It seems that ‘distribution forces’ appear more dominant as global equities are showing negative reversals below technical support levels on heavier volume. The big technology and financial stocks have recovered but this narrow advance is typical of a bull market in its very late stages. In fact, the number of 52-week new lows continues to exceed the number of 52-week new highs on individual stocks, another indicator of a weak advance. On top of that, trading volume on up days has only been 70-80% of average volumes while the volume on down days has been 125-150% of the average, suggesting that there are more sellers still trying to get out. Exchange Traded Funds (ETFs), the backbone of the advance over the last three years, have seen net redemptions of over US$10 billion during this advance, also suggesting investors were already fully invested. The technical analysts at UBS Securities have developed an Intraday Recovery Score, which measures the strength of any stock advance. This indicator recently clocked-in at -10, the first time it has been negative in two years. Moreover, it’s the lowest level for the indicator since 2008! The bottom line is that we expect much more volatility in stocks over the next few months and will probably re-visit those Feb. 8th lows once again. We are proceeding cautiously.
The bigger problem for stocks in the past month, though, has been the rising trade rhetoric coming from the U.S., more specifically from President Trump as he tries to shore up support from this ‘base’ in front of fall elections and poor poll results. On that note, he has re-visited his election promise to come down hard on trade partners, particularly China. The first volley was a 25% tariff on imports of steel and 10% on imports of aluminum into the U.S. Canada and Mexico were exempted from these tariffs for now given that NAFTA trade negotiations are still underway. The chart below shows how global trade as a percentage of GDP peaked just after the financial crisis, bounced back a bit and then has been falling again. It now sits at just over 40% of global GDP, over 10 percentage points below the peak levels achieved less than 10 years ago. This reverses a trend in globalization that had been taking place since the early 1960s, when trade accounted for only about 15% of global GDP.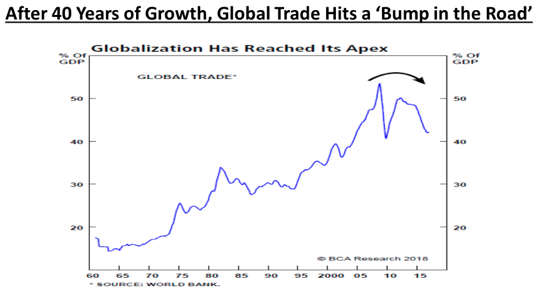
While it remains a very political topic, expanding global trade has been responsible for much of the strong economic growth we have seen over the last four decades. The rise of U.S. multinationals in the consumer products, industrials, technology and pharmaceuticals industries is clear evidence of how domestic companies have gone to global markets to expand both sales and production while, at the same time, reducing costs. That expansion not only broadened the sales base for all these companies, it also allowed them to become more profitable by moving production to the most cost-effective areas.
Our investment management team is made up of engaged thought leaders. Get their latest commentary and stay informed of their frequent media interviews, all delivered to your inbox.