Keep connected
Our investment management team is made up of engaged thought leaders. Get their latest commentary and stay informed of their frequent media interviews, all delivered to your inbox.
John Zechner
May 1, 2023
In an investment environment where the ‘macro seems to be everything’, the economic playbook is not going quite according to prior experience or overall expectations. Since the Federal Reserve first kicked off its inflation-fighting campaign 15 months ago, it has raised interest rates nine consecutive times and wound down its pandemic-era bond-buying program, notching the fastest pace of monetary policy tightening in four decades. So far, it has achieved a balance that its critics thought nearly impossible, cutting headline price growth nearly in half while keeping the U.S. economy humming along. In fact, employment levels continue to be surprisingly resilient as the service economy retains momentum from its full re-opening as well as increased international travel. But the fight against inflation seems to be stalling as the initial benefits of a sharp fall in oil and other commodity prices begins to wear off. Thus the Fed’s job seems to be far from done at this point, notwithstanding stock market expectations of a ‘pivot’ to easing in the back half of this year. This means that the risk of a ‘policy misstep’ is growing, and the consequences of over- or undershooting would be severe. The central challenge for the Fed is that the economic outlook is souring at the same time that progress on reining in inflation is stalling out. Economic growth in the first quarter decelerated more than expected, while the Fed’s preferred inflation gauge is down less than a full percentage point from its peak and still more than double the bank’s 2% inflation target. A continued transition to a more restrictive policy stance will ramp up the pain, further reducing demand for goods and services, weakening the labour market, and greatly increasing the cost of servicing debt—including mortgages, car loans, and the government’s more than $31 trillion in federal borrowings! The sharp rise in interest rates will also test the strength of a generation of companies that grew up in an accommodative policy environment and haven’t had to function under tighter monetary conditions.
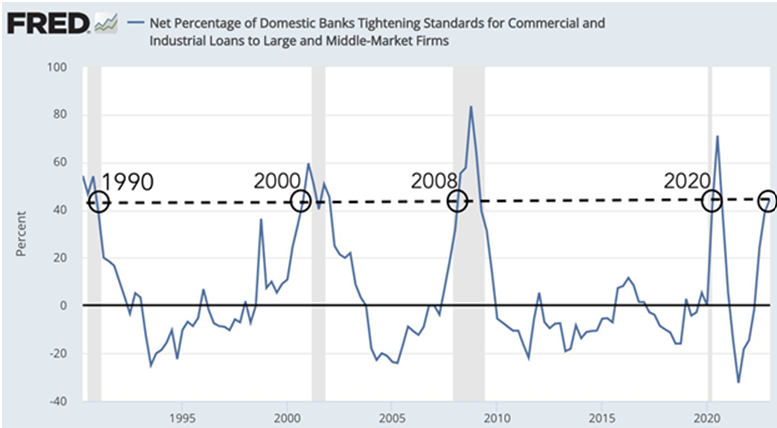
At the same time, the financial sector is on increasingly unsteady footing. Higher rates have wreaked havoc with bank balance sheets; the industry’s unrealized losses on securities totalled more than $620 billion in the fourth quarter of 2022, according to the Federal Deposit Insurance Corp. The first quarter of this year saw two high-profile bank failures, which forced the Fed to establish an emergency lending facility. And Wall Street is rife with talk of impending chaos among nonbank lenders and alternative-asset managers, should interest rates move much higher. The failure of Silicon Valley Bank and the impending rescue of First Republic Bank highlighted the risks that have resulted from the sharp reversal in interest rates eighteen months ago. This has caused banks to tighten lending policies dramatically. The chart below shows what happened in past cycles when banks had to tighten lending to these levels. Recessions were always the ultimate outcome. We continue to believe that it is simply a matter of ‘when’ not ‘if’ the U.S. economy slips into recession and drags Canada down along with it.
We are expecting negative growth in both the third and fourth quarters of this year. The bullish case for stocks is that the downturn ends there and earnings begin to recover in 2024. Negative growth in the back half of the year would also support the case for some reversal in Fed policy, assuming that inflation levels do not remain elevated as the economy goes down. That would be another period of ‘stagflation’ similar to what we saw in the early 1980s, which was clearly not good for stock prices!
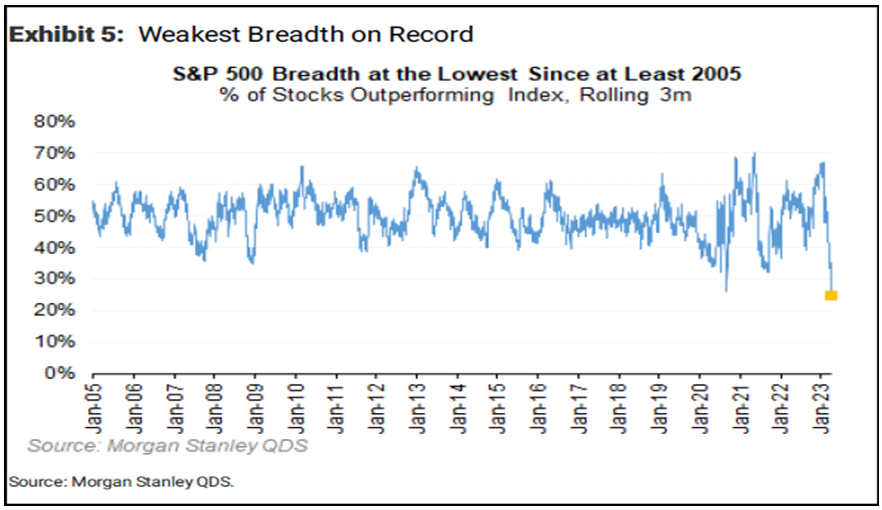
Most stock market technicians will tell you that any good advance in the stock market is supported by increasing ‘breadth’ i.e. the number of stocks participating in said advance. The opposite seems to be happening in the market this year, though, as the S&P500 has been “supported” by just seven mega-cap tech stocks right now, and it’s extremely reminiscent of the 1990s tech bubble when five large tech companies, Cisco, Nortel, Lucent, Microsoft and Intel accounted for the majority of the final upleg. This time around we have seen seven companies — Apple, Microsoft, Nvidia, Meta, Tesla, Amazon and Alphabet — account for 95% of the S&P500′s total return so far in 2023. Everything has gone right for Big Tech. First off, valuations have risen because long-dated bond yields have dipped as the market anticipates a pause in the Federal Reserve’s interest-rate increases. Those lower yields raise the current discounted value of the increasing profits those growing companies are expected to pump out for years to come. At the same time, analysts are more upbeat about earnings. Analysts’ forecasts for 2023 earnings per share have risen this year for all these companies, except for Amazon. Smaller tech companies have been less fortunate. The Russell 2000 Growth Index, which counts the technology sector as its second-largest weighting, has gained just over 3% this year. Slowing economic growth is raising concern about their revenue, an issue that is made worse by competition with the larger tech firms. Meanwhile, most economically sensitive ‘value sectors’ such as financials, energy, industrials and consumer discretionary stocks, have weakened this year as they absorb the brunt of the worry about the economic outlook. General Motors was a classic example of this as the company handily beat earnings expectations for the quarter and then raised guidance for the rest of the year, only to see the stock fall over the next four trading sessions to end the month.
The net result is a stock market that is not well supported by diversity with the worst breadth reading on record. This was the case again in April as large cap tech helped push the Nasdaq Index higher by 0.4%, pushing its year-to-date gain to over 17%. Meanwhile the broader, more ‘value-oriented’ smaller cap Russell2000 Index dropped by 1.9% in April, wiping out all its year-to-date gains. Given that large cap tech has been the leader, helped by expectations of Fed easing in the second half of the year, a change in that narrative is a big risk for the main averages. However, as we saw in 2000, once the bubble burst there were all the other asset classes that had very attractive valuations and provided strong relative performance in the ‘post-bubble’ era.
Investors also seem to be growing more numb to first-quarter earnings—even for companies that top expectations. That isn’t a great signal for the market. Companies beating analysts’ forecasts for both sales and earnings per share are seeing their stocks rise just 0.3%, lower than the five-year average of 1%, and so far the majority of companies are beating expectations. Taking a step back, investors have been unable to drive stocks out of the trading range of the past year. One big reason is that the stock market is still expensive. The S&P 500’s double-digit-percentage rise from an October low point brings it to a roughly 18 times forward earnings multiple, up from a little more than 15 times at the lows of last year. Given the larger rise in bond yields over the past couple of years, which makes returns in those safer investments more attractive, stocks have become too expensive for many investors to tolerate. That logic is difficult to argue with, which is why we continue to hold similar weights of both stocks and bonds in client portfolios, versus a typical period when we have somewhat higher weighting in stocks versus bonds.
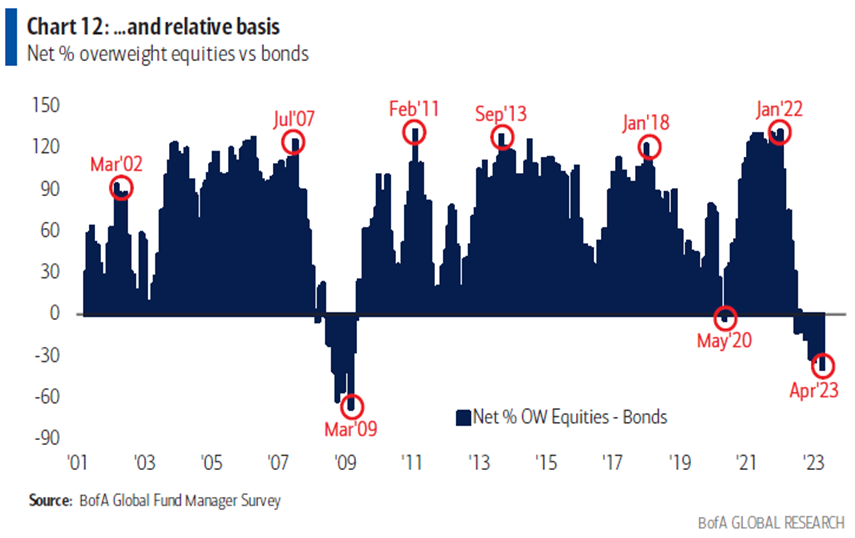
For those looking for some good news in all of this, we would point out that most of this bad news seems to have already impacted investment decisions. Investor allocation to equities relative to bonds has dropped to its lowest level since the global financial crisis as worries about a recession take hold, according to Bank of America Corp.’s global fund manager survey. In the most bearish survey of this year — the first after banking turmoil roiled markets last month — investors indicated that fears of a credit crunch had driven up bond allocation to a net 10% overweight — the highest since March 2009. A net 63% of participants now expect a weaker economy, the most pessimistic reading since December 2022. While this negative positioning does not guarantee we are at the bottom, we can certainly see that the pior two times we reached such levels of pessimism on this indicator, it also marked the low in stocks for that cycle. What we can infer from this, though, is that there doesn’t appear to be a huge amount of selling pressure in the pipeline, which should keep the major stock averages from breaking below their October 2022 lows, even if the earnings and economic data remain under pressure. Also, the period of interest rate tightening does seem to be very near, if not at, its conclusion. The bigger risk here is that these higher rates remain in place for longer than investors are currently expecting in order to get inflation expectations truly under control.
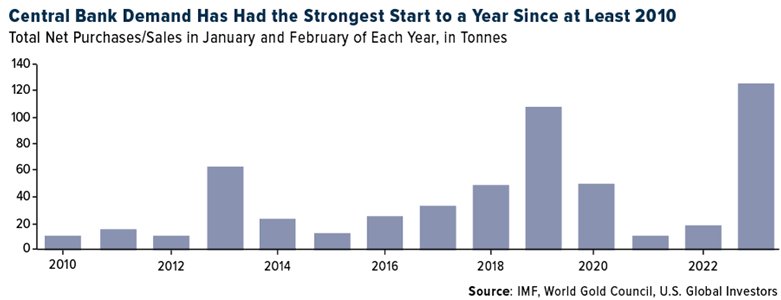
One of the more disappointing investments of the past few years has been gold. It seemed that everything was in place for a more sustained rally. Interest rates had been at record low levels with ‘real’ (inflation adjusted) interest rates actually in negative territory. Add in rising inflation, global growth risks from the pandemic, record levels of debt in fiat currencies and ongoing geo-political risks, it would seem that gold had everything it needed to go higher. In many ways it did, as gold measured in every currency except the U.S. dollar has been at record highs for over two years. But the U.S. dollar has acted as a magnet for global capital flows and that detracted from gold’s advance. However, with growth slowing in the U.S. and interest rates near their peak, we have also seen a rollover in the strength of the ‘greenback’ over the past six months. The signficance of this has not been lost other Central banks, which accumulated gold at the fastest pace on record in the first two months of 2023, according to a report by the World Gold Council. In January and February, central banks collectively bought a net 125 tonnes of the metal, the highest amount for the year-to-date period since banks became net buyers in 2010. While the ‘crypto crowd’ still sees assets such as Bitcoin being the new ‘digital gold’ and replacing demand for the precious metal over time, the chart below argues otherwise as we have seen the major central banks continue to accumulate gold.
The best way to play this move, in our view, is through the gold stocks. As a group they are trading at multi-decade lows in terms of valuation. The Canadian mid-sized producers as a group are trading around 4 times operating cash flow and a 30% discount to Net Asset Value. This compares to average trading levels over the past 30 years of over 10 times operating cash flow and 1.5-2.0 times Net Asset Value. The gold companies are fully aware of this discount and have been increasing corporate activity to take advantage of the price weakness. We expect this trend to continue and therefore favour the small and mid-sized producers as they are viable targets.
Investment Strategy Update. While our underweight position in large cap tech hampered performance slightly in the past month, we see very little further upside from that group in the short-term as valuations have migrated back up to the high end of their historical ranges. Technology stocks will always constitute a significant part of any investment portfolios due to their inherent organic growth rates, but right now we see far better ‘risk-reward’ trade-offs in the mid-sized cyclical and value stocks. While earnings in the cyclical stocks will be hurt by the impending economic slowdown, valuations have already factored in most of this weakness. We see stocks in the auto and leisure good industries trading at single-digit earnings multiple. Moreover, inventories are nowhere near the peaks typically seen late in the economic cycle since the semi-conductor shortage and the pandemic shutdown had put constraints on manufacturing, such that these companies need to continue to run near full capacity just to meet existing demand and build inventories back to normal levels. BRP, Magna, GM and Martinrea remain our top names in those sectors. We also like Air Canada in the consumer discretionary sector as travel continues to rebound and the company adjusted cost structures and capacity to improve profitability during the pandemic and now will start to generate substantial operating cash flow. While still somewhat cautious on the bank stocks due to tighter lending standardsand an economic slowdown, most Canadian and money-centre U.S. banks have strong deposit bases, excellent capital ratios and trade at the very low end of their traditional ranges, with the benefit of high dividend yields while investors wait for the economy to through its downturn. We also have added to holdings in the energy sector. While investors lament the inability of crude oil to hold above US$80 versus some expectations of another march up to US$100, we would rather focus on the fact that these companies are generating massive free cash flows and trading at historically low multiples even assuming oil prices only in the US$75 range. Many Canadian producers (Baytex, Whitecap, Crescent Point and Cenovus top our list) trade at cash flow multiples of only 3-4 times at current strip (oil) prices and free cash flow yields over over 20%!
In terms of our asset mix strategy, we do remain somewhat cautious on stocks, but see more potential for upside surprises in the next year and therefore don’t want to carry too low a weight. We currently have about 45-48% of most investment portfolios in stocks, with a somewhat more defensive bias (i.e. overweight telecom stocks, pipelines, energy and golds). We added to bonds earlier this year and continue to have about a 40% weight in primarily government mid and long-term bonds. We expect a peak in short-term interest rates in the current quarter and then reductions beginning in 2024. Longer-term interest rates have already been falling and we expect that the ten-year U.S. bond will trade back down to yields in the 2.5%-3.0% range over the next year. Cash remains an attractive alternative given the sharp rise in short-term interest rates. We are currently carrying cash positions of about 10% in most accounts, both for income purposes as well as for liquidity during any potential market weakness. Bottom line, it’s hard to get really excited about stocks knowing that we are most likely headed into a recession in the back half of 2023 and still face a period of elevated interest rates (at least in comparison to where they have been over the past decade). But history has also shown us that times of economic weakness and investor despondency are also times to be looking to position for the next cycle since most of the bad news is already ‘priced in.’ We may not be quite there yet but it feels like we are getting closer!
Our investment management team is made up of engaged thought leaders. Get their latest commentary and stay informed of their frequent media interviews, all delivered to your inbox.