Keep connected
Our investment management team is made up of engaged thought leaders. Get their latest commentary and stay informed of their frequent media interviews, all delivered to your inbox.
John Zechner
December 5, 2018
Barring a sharp December rebound, 2018 will go down as the year in which nearly everything declined. A ‘synchronized global slump’ has dragged down stocks, bonds, gold and crude oil, inflicting year-to-date losses on an unprecedented proportion of assets around the world. Of the dozens of asset classes across various kinds of securities and commodities in developed and emerging markets, 90% of them are down on the year, according to Deutsche Bank. In more than a century of market data, never has a calendar year seen so many assets post negative returns. That global downdraft has weighed on Canadian markets as well. The S&P/TSX Composite Index has dropped 7% this year, while the rise in interest rates means both government and corporate bonds have seen moderate price declines. Currencies and commodities have suffered the same fate as the Canadian dollar has lost almost 5c US and the price of Alberta crude oil has plunged by 50%. The withdrawal of stimulus and the rise of interest rates seem to have stoked investors’ concerns about valuations, which has played out on formerly resilient market leaders, U.S. technology shares. The FAANG group of stocks has fallen by 24%. Commodities continued to be under pressure in November with crude oil leading the decline, falling over 20% for its worst month in over 10 years! Even Bitcoin, the ‘superstar’ of 2017, joined in the parade of losers. The world’s largest cryptocurrency ended November down 37%. The digital currency is now down more than 70% since the start of 2018 and 80% from its all-time high hit late last year.
Stocks were volatile again in November, following on the extreme market weakness the prior month, but did finish strongly. The late October recovery continued into early November, pushing the S&P500 back up to 2800 and setting up for a potential year-end rally. But some weaker economic data and disappointing guidance from technology companies combined to push stocks right back down again, coming close to the low levels seen earlier this year. However, once again at month end, the U.S. Federal Chief Jerome Powell dialled back his aggressive comment on interest rates a bit. Was his thinking impacted by the personal criticism he received from the President? Then the White House ‘dangled’ some optimism about a possible trade deal with China at the G20. That lead to another late month really for U.S. stocks as Dow registered its biggest one-week rise since November 2016, climbing 5.16% and the S&P 500 rose 4.85% in the final week of November, its best weekly performance since 2011.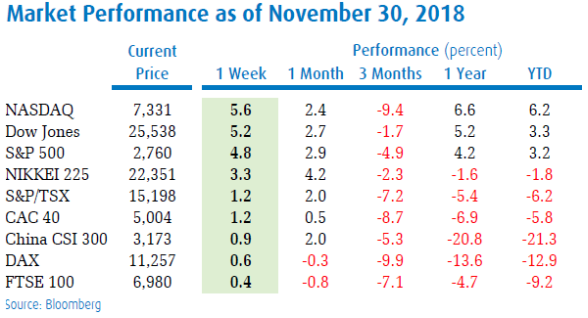
The Trump administration and the Chinese government did agree to a temporary trade truce, pledging to delay threatened tariffs for 90 days while they work toward a concrete trade deal. Washington will push Beijing to address thorny issues such as forced technology transfers and alleged intellectual property theft — which the two sides have failed to resolve despite months of attempts. While the U.S. President once again pointed to the meeting results as a ‘fantastic deal’, the Chinese press and official commentary was much less optimistic, pointing out that negotiations have yet to start.
While all the pullbacks in the past three years have ended up being good times to ‘buy the dip’, that may not be playing out again this time as we have seen 20%+ declines in the prior big market leaders such as Amazon and Netflix as well as high-flying chip names such as Nvidia and AMD. While analysts are still carrying earnings growth estimates of over 10% next year, the market seems to be saying that those expectations are too high. With slowing earnings growth, some serious economic growth issues in some major foreign economies and the removal of the ‘great tailwind’ of lower interest rates, you have to wonder what is left to drive stock prices higher? Moreover, the plethora of new passive investment products (such as ETFs) over the past few years, have flooded the investment landscape with a product that has yet to be tested in a more severe downturn. You don’t have to look too far back in the history books to see how the housing market handled a similar situation back in 2007. The results were not pretty!
The bottom line, as shown in the chart below, is that the S&P500 has broken its key support line (200 day moving average) for the first time since early 2016, at the same time as we’ve seen a downturn in global PMIs (Purchasing Managers Indices) in the Emerging as well as Developed economies. 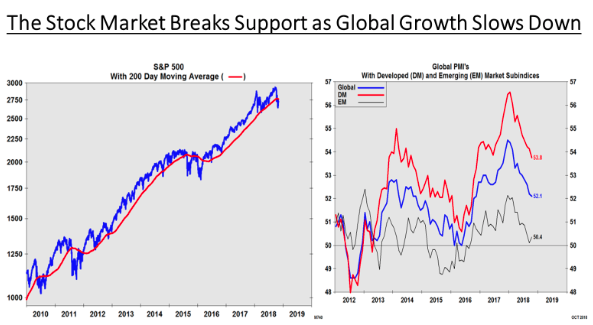
Although stocks recovered at month end and have started December on a positive note, we have yet to see the traditional ‘spike’ in volatility that we tend to see during any correction. While the VIX (measure of volatility) has risen in the past two months, we have yet to see the type of surge that would indicate a full flush of sellers. With global growth in a clear slowdown mode and interest rates still heading higher, we still believe there remains downside risk in the stock market. Optimism about a potential lessening of trade tensions between the U.S. and China could help stocks recover some of their recent losses heading into year-end, we will closely watch global money flows in early December to see if there is much money of the sidelines still looking to buy into stocks.
1 2
Our investment management team is made up of engaged thought leaders. Get their latest commentary and stay informed of their frequent media interviews, all delivered to your inbox.