Keep connected
Our investment management team is made up of engaged thought leaders. Get their latest commentary and stay informed of their frequent media interviews, all delivered to your inbox.
John Zechner
June 30, 2020
More evidence of this new flow of retail money is in the flood of new retail investors into online brokers such as Charles Schwab and TD Ameritrade as well as masses of younger investors using the ubiquitous trading app ‘Robinhood.’ Alongside the market’s major rebound from the depths of its March low has developed a popular narrative that new retail trades are the key driving behind the most recent leg of this rally. Online brokers are being flooded with new customers. About 1.2 million retail clients started new brokerage accounts at Fidelity Investments between March and May, a 77% increase from the same period last year. Zero commissions, fractional trading and a perhaps a lack of televised live sports have also driven some young investors into the market. Some of the most popular stocks traded on the Robinhood app have been some of the biggest winners in the market.
That kind of enthusiasm has some market observers worried as it is highly reminiscent of investor behaviour during the ‘tech bubble.’ In the late 1990s, small investors chased flimsy companies with .com attached to their names, buying that came after the Fed slashed interest rates in 1998 amid a financial crisis. In the spring of 2000, the Nasdaq market collapsed. The key parallel between 2000 and today is that retail investors are seeing the stock market as a can’t-miss opportunity. Congress has supplied about $3 trillion in fiscal stimulus and the Fed’s asset portfolio has increased another $3 trillion through bond purchases and loans to stabilize an economy crippled by the global pandemic. Critics say these steps bolstered the confidence of investors but also have interfered with the proper functioning of financial markets by encouraging investors to ignore risks attached to both stocks and bonds, partly because they believe the Fed will step in if prices tumble again. Because of the Fed’s interventions, market prices and credit spreads don’t have the information content that we think they have Foreign investors have also become much bigger buyers in 2020 as they initially moved to the safety of the world’s reserve currency, the U.S. dollar.
The myth of the ‘V-shaped’ recovery. The other narrative driving the stock laggards lately has been the view that the ‘re-opening’ is going better than feared and that earnings are going to recovery sharply. Some support was lent to this thought in a stunning report that defied expectations on June 5th that May nonfarm payrolls were reported to have increased by 2.51 million in May after a revised 20.69 million plunge in April. The May result was a mind-boggling 10 million better than the -7.50 million median forecast. While some data has been better than expected, particularly the May U.S. jobs report, much of the sharp recovery is a mirage best on how decimated these businesses were in the initial downturn. It’s the old math; an indicator drops from 100 to 20 and then bounces back to 40, the bulls point out that there’s been a 100% recovery, a real ‘V-shape.’ While that is true, the reality is that the indicator is still only at 40 (60% below the peak) and that the continued recovery is going to be more difficult with each step. The chart below of the year-over-year change in air travel in the U.S. demonstrates our point. While the numbers have definitely improved off the lows and will continue to do so, they are still down over 70% versus last year. Domestic personal travel has started to pick up again but business and international travel could be a much slower road back, especially since so many companies have made the adjustments to online meetings and may not be rushing back to the former conditions anytime soon.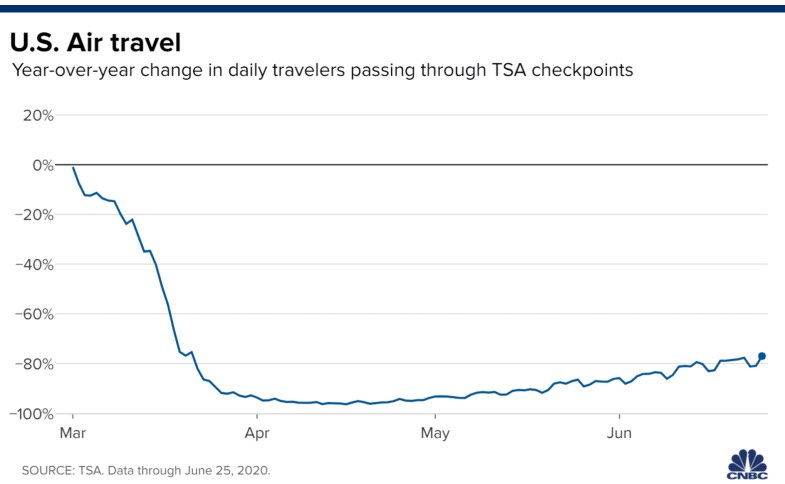
Airlines, restaurants, theatres, them parks and shopping malls will not be going back to anywhere close to where they were for a very long time, if ever! If the difference between running at 85% capacity versus 70% capacity in the past has been what separated boom versus ‘bust’ times, then what can we say about industries that will take two years just to get back to 50% capacity? This is another example of an area where we see risk for stocks as the profit models suggest that it will take a much longer time to get back to 2019 levels than the stock market looks to be counting on as indices rush back to their old highs.
Also, while the stimulus cheques have helped spending on both sides of the border, most of the PPP money in the U.S. is due to run out at the end of June. When that happens, many businesses will be forced to lay off workers, and some businesses will go bankrupt. The federal unemployment benefit supplement is set to wind down at the end of July. If they are not extended, the economy will face another downward lurch. Massive state intervention may be needed to prevent a recession from turning into a depression. A V-shaped recovery? We’re reluctant to put much money on that one! But in more stock market-specific terms, the way things go in the coming months comes down to a few key questions: Can this market continue acting like an early bull phase, with broad strength, cyclical-stock leadership and an ability to look through near-term economic struggle? How much more can be expected of the expensive growth-stock goliaths in pushing the indexes forward as investors wait for the recovery to gain traction? Is there still enough cash and caution lying about the market to buffer the downside and serve as fuel for rally-chasing in coming months?
Our investment management team is made up of engaged thought leaders. Get their latest commentary and stay informed of their frequent media interviews, all delivered to your inbox.