Keep connected
Our investment management team is made up of engaged thought leaders. Get their latest commentary and stay informed of their frequent media interviews, all delivered to your inbox.
John Zechner
August 27, 2018
While global trade tensions make headline news, U.S. stock markets keep grinding higher. The S&P500 Index continued its recent recovery and exceeded its January high on August 21st. The next day it became the longest bull market in history at over 3,400 days. Since its bear market low on March 9, 2009, it has risen more than 320%! As impressive as that has been, the rally still falls short of the record 417% run in the 1990s, which was also powered by the technology group, notably the frothy ‘dot.com’ stocks. The latest leg of the bull run for the U.S. stock market has been driven by booming economic growth and renewed strength in quarterly corporate earnings. Investors have also bet that the global economy will continue to expand at a steady pace even amid turbulence in some emerging markets such as Turkey and Venezuela. The largest stock advances in recent years have been concentrated in the U.S. technology companies that have practically become synonymous with technical prowess and business dominance, notably Apple, Amazon and Google parent Alphabet. The gains were of course aided by the U.S. corporate tax cut in December, delivering a rebuttal to skeptics (ourselves included) who have argued that everything from a slowdown in China’s growth to rising U.S. interest rates to intensifying trade tensions would soon end the market’s run. But the stock market continues to be carried higher by the influx of buying of Exchange-Traded Funds (ETFs), the low-cost passive investing alternatives that have replaced active managers but have yet to be tested in any significant market decline. The other big difference between this bull market and past cycles is that the strength of the economic recovery underlying the stock market advance has been much weaker than past cycles such as those from 1981-90, 1991-2000 or 2002-2008. The impetus for the exceptional gain in stock prices and valuations in this cycle was the reduction of interest rates to record lows, which drove money into stocks as the most attractive asset class.
The joy in the U.S. stock market is no longer being shared, however, with the rest of the global stock markets. While most global markets rallied to new highs in 2017, this year has not been as kind to investors across the globe including Europe, Asia and especially in the Emerging Markets. Those markets have de-coupled from the U.S. this year as money flows have been negative in Asia and the Emerging Markets. This continues a trend that has been occurring for most of the current bull market run. In mainland China, the Shanghai Composite is up only 27% since March 2009. The divergence has intensified in recent months as trade escalations continue. The Shanghai index tumbled into a bear market earlier this summer. Most emerging markets have also struggled to keep up. The MSCI Emerging Markets Index has risen by about 150% during the U.S. bull market, well below the 400% plus gain for U.S. stocks and has been stumbling more lately, falling near bear-market territory. The divergence between the U.S. and the rest of the world has grown more stark this year. As shown in the chart below, the U.S. market started to recover from the February sell-off in early April while the Emerging Markets index has continued lower. 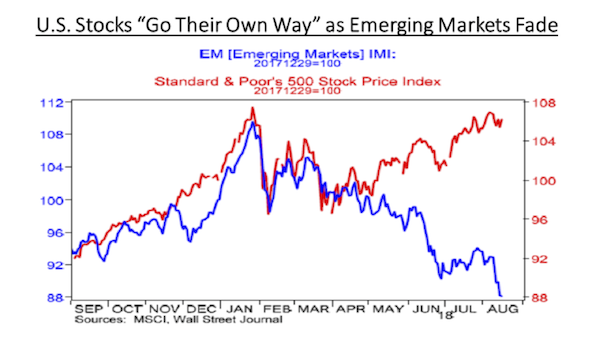
Strong ‘tax-cut-aided’ first quarter U.S. earnings growth started the recovery and it has continued as U.S. economic growth hit its fastest pace in nearly four years in the 2nd quarter while growth elsewhere in the world has hit some speed bumps. As we pointed out in last month’s comments, “The net result of this diverging performance is that global stocks are now trading at their largest discount to U.S. stocks on record (28% lower).” To be fair, emerging markets should trade at far lower earnings multiples than developed markets due to their higher risk profile, but investors often become enamored with their higher growth profile and pay up for it. When this growth ultimately becomes disappointing and risk resurfaces, investors rush for the exits, as they are doing now in Turkey. While this has made the most headlines, situations have deteriorated even more in emerging economies that suffer from both economic and political risks. Venezuela has seen their currency depreciate by 95% and inflation is now running at over 1,000,000% (yes, one million percent!) per year!
Given the divergence in valuations between developed and emerging markets, investors wonder whether emerging markets will rise to fill in this difference or developed markets, particularly the U.S., finally follow these other markets to the downside? We suggest the latter as the five factors which have powered this bull run – record low interest rates, high investor confidence, rising company profits, low competition from other investments and an economic recovery – appear to have reached their limits. In fact, one of the biggest catalysts of the advance has started to reverse as the ‘zero interest rate’ policy of most global central banks, arguably the biggest factor in the ongoing bull market in financial assets over the past ten years, is replaced with a rising rate scenario. We continue to point out potential cracks in the U.S. uptrend including the fact that the advance has been so narrow, even compared to earlier this year when we saw stocks peak in late January. Today only 2 of the 11 S&P500 sectors were at new highs, compared with 8 of 11 at the January peak. Also, at that time, over 25% of stocks were hitting 52-week highs, versus only 9% today. More pointedly, only four stocks (Amazon, Netflix, Microsoft and Apple) are responsible for over 40% of the gain in the S&P500 in 2018. That narrow breadth is not typically a good sign in an aging bull market.
1 2
Our investment management team is made up of engaged thought leaders. Get their latest commentary and stay informed of their frequent media interviews, all delivered to your inbox.