Keep connected
Our investment management team is made up of engaged thought leaders. Get their latest commentary and stay informed of their frequent media interviews, all delivered to your inbox.
John Zechner
April 30, 2019
Other more anecdotal industrial indicators, which have been accurate predictors of economic direction in the past, have also worsened. ‘Economically sensitive’ lumber is down 23% from its January high and is down over 50% from the peak in the second quarter of 2018. Semi-conductor sales, another leading indicator for the industrial and technology sectors, are down 10% this year, even though semi-conductor stocks have been one of the leading performers in the stock market this year. Coal production is down 27% year-over-year, while truck traffic, electricity production and container shipments are all down. The Rail Demand Index and Rail Carloads (shown below) have been in downtrends which appear to be accelerating. Other data points for economically sensitive indicators are also signalling some risk ahead. 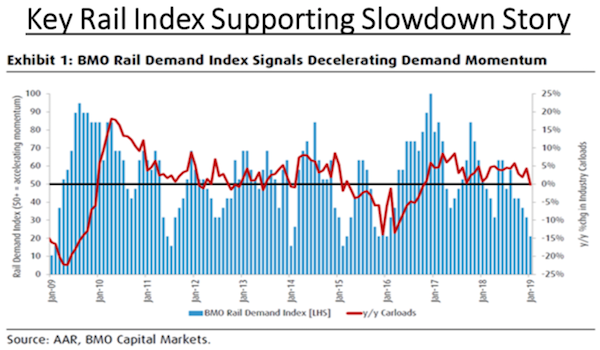
Have corporate profit margins finally peaked for this cycle? Analysts remain generally bullish on corporate profits over the balance of the year. That expected recovery, along with low interest rates, has been the fodder for stronger stock markets. But we continue to believe that most of that great support is ending. Over the last few decades, almost every major driver of profit margins improved. Labour’s bargaining power fell, corporate taxes fell, tariffs fell, globalization increased, technology allowed for greater scale and lower marginal costs, anti-trust enforcement fell, and interest rates fell. These factors have produced the most pro corporate environment in history. On top of that, corporate buybacks, which further lift earnings per share and shrink the supply of stocks, have also soared to record highs. Now many of these drivers of high profit margins are now under threat. The forces that supported margins over the last 20 years are unlikely to provide a continued boost. Incentives for offshore production have been reduced as global labour costs have moved closer to equilibrium, with domestic costs and rising trade conflict increasing the risk of offshoring, while the potential tax rate arbitrage from moving abroad is now much smaller. On the buyback front we also wonder how much longer they can continue at this pace, especially if economic growth slows down and corporate cash flows get squeezed. S&P500 fourth quarter 2018 Buybacks totalled $223 billion, once again setting a new record by surpassing the third quarter amount of $203.8 billion, up 9.5%. The record buybacks came as the S&P500 Index collapsed by 14% in the quarter. 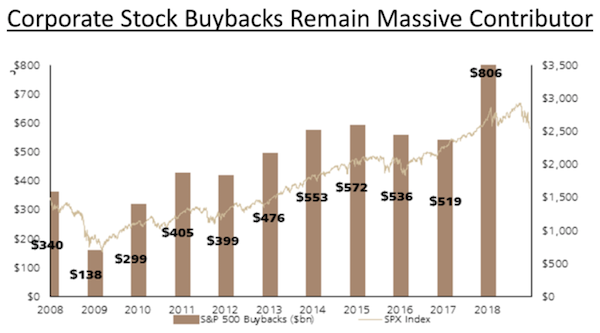
In the end, are stock buybacks really the best use of a company’s capital? While the buybacks support stock gains in a rising market, they look like a very poor use of shareholder capital in a weaker environment. Witness General Electric’s buyback of over $26 billion of stock from 2015 to 2018 at an average stock price in excess of $20. Those purchases look like a very poor investment with the stock now trading in the $10 range and the company suffering from an over-indebted balance sheet which is forcing them to sell off core company assets.
Does Debt Matter Anymore? With global debt surging to over US$100 trillion in the past ten years, or greater than 150% of gross global output, and corporate debt now exceeding the lofty levels seen prior to the Financial Crisis in 2008, why is it that investors appear to slough off the worries from these numbers? Global Modern monetary theory seems to support the notion that sovereign debt doesn’t matter anymore since it’s just the government borrowing from domestic savers who it can tax anyways. But past examples of rampant debt growth have not ended well (i.e. South America in the 1970s, Europe in the 2000s). The worst risks come from the countries that have borrowed in foreign currencies, which is why emerging markets have always been the first casualties of any debt crisis. The U.S. is now the world’s largest debtor, with over US$22 trillion in sovereign debt. But the only way out of that debt bubble is to ‘inflate’ their way out i.e. continue to expand the money supply which eventually leads to a currency depreciation and higher inflation levels (the ‘Latin American Solution’). This suggests risk for the U.S. dollar ‘down the road’. The most likely beneficiary in this scenario of a falling U.S. dollar would be the commodity currencies such as Canada. The notion behind MMT is that as long as the Federal Reserve can keep interest rates low without sparking inflation, the national debt and budget deficit won’t be an issue. Fed Chairman Jerome Powell recently said the economic theory is unworkable. “The idea that deficits don’t matter for countries that can borrow in their own currency I think is just wrong,” Powell said during congressional testimony in the Senate.
Global debt has jumped since the financial crisis, though some ratings agencies think that it poses significantly less danger than the last time around. Corporate, government and household indebtedness rose to $178 trillion as of June 2018, a 50% increase from a decade ago, according to figures S&P Global Ratings. The expansion was especially acute at the government level, which stood at $62.4 trillion, or 77% higher than it did before the public borrowing binge began.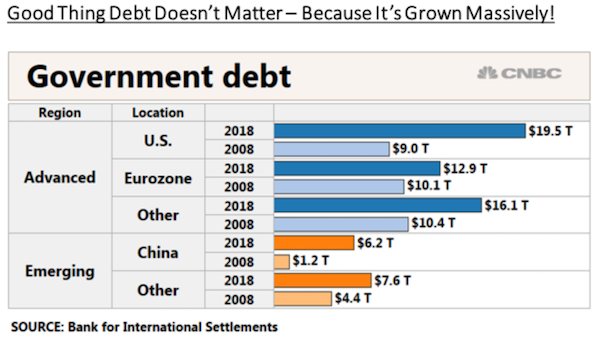
The real risk would come if we ever see an uptick in inflation that would push interest rates higher. There would be no ability for governments to service those debts and the ensuing collapse would make the Financial Crisis in 2008 pale in comparison. How all of this dovetails with stock markets back at record highs really seems to stretch the bounds of logic and is the primary reason why we maintain an extremely cautious/conservative investment stance. However, we will continue to watch how the economic and earnings data unfold in the remainder of the year. Maybe our bearish outlook will be proven wrong. History doesn’t suggest it though!
1 2
Our investment management team is made up of engaged thought leaders. Get their latest commentary and stay informed of their frequent media interviews, all delivered to your inbox.