Keep connected
Our investment management team is made up of engaged thought leaders. Get their latest commentary and stay informed of their frequent media interviews, all delivered to your inbox.
John Zechner
April 30, 2019
Strength in the stock market so far in 2019 has been driven principally by the abrupt shift in tone by the U.S. Federal Reserve in early January from a bias to raising interest rates and reducing the size of their balance sheet to a ‘market loving’ stance of being “patient” about the need for further interest rate hikes and ‘quantitative tightening’. This reversal has been treated by stocks investors as a ‘green light’ to risk taking, as all the fears about rising rates and their impact on growth and market valuations in the final quarter of 2018 were effectively eradicated. While stocks rallied sharply once those rate risks were removed, the future direction of stocks is now more dependent on what the earnings and economic data actually deliver. That is why the current earnings season is so critical. The early returns have given fodder to both the bulls and the bears. While the numbers have so far exceeded expectations, especially in the higher growth areas of technology, those expectations had probably been overdone to the downside due to the worries in the fourth quarter. The ‘expectations bar’ was effectively set extremely low. Even with the plethora of ‘beats’, the earnings are still down 3% on a year-over-year basis, the weakest overall results since 2016.
The economic results have also been nothing to get excited about, in our view. While growth in the first quarter was helped by stimulus from China, some bounce back from the government shutdown and optimism in the key interest rate sectors such as housing, Europe and Japan remain close to recession territory and the U.S. results are in a clear decelerating trend. We have seen a continued deterioration in growth on a global basis over the past year. While stock investors have cheered a recovery in employment numbers and retail sales from the fourth quarter levels, trends are still weakening with the Citi Economic Surprise Index in the U.S. at a 2-year low and the global index at a 5-year low. U.S. ISM indices, mortgage market indices, German IFO and other key data all showed more weakness in releases in the past few weeks.
These economic risks are not going unseen by key central banks and monetary authorities. While the U.S. Fed’s January reversal in policy is well documented, the Bank of Canada recently reduced its outlook for growth in 2019 from 1.7% to 1.2% due to slower global growth and increased trade conflicts. The International Monetary Fund (IMF) predicted in its latest economic forecast that “the global economy has slowed sharply since last summer and will rely on a precarious boost from a few emerging markets to reverse the loss of momentum”. It reduced its economic outlook for 2019 and 2020, as the Fund judged that advanced economies would “continue to slow gradually” into next year. Global growth slowed sharply in the second half of 2018 from 3.8% in the first half to only 3.2% in the final six months, with industrial production and trade hit hard. Activity softened amid an increase in trade tensions and tariff hikes between the United States and China, a decline in business confidence, a tightening of financial conditions, and higher policy uncertainty across many economies. This slowdown led the fund to sharply cut its forecast for 2019, with the world economy now expected to grow 3.3% in 2019, down 0.4% since the last full forecast in October 2018. The projected growth rate for 2020 was also reduced.
In the world’s largest economy, the bulls continue to view strong employment and consumer confidence as reasons for a continuation of what is now the longest economic expansion in modern history. But a deeper dive into the full range of components of growth paints a much less positive view. Better trade data has been driven by seeing imports slow down at a faster rate than exports. While that does boost the overall growth numbers, it seems like a convoluted way of achieving growth. Even the stronger data points lately seem to have darker linings. The U.S. Commerce Department’s preliminary reading of first-quarter GDP estimated quarter-over-quarter growth at a 3.2% annualized rate – far better than most economists had expected. But a closer look shows we shouldn’t be too quick to slap a gold star on this report since it is really the weakest 3.2% you’ll ever see. Most of the growth came from two components: net trade (exports minus imports) and inventories. Excluding those two components, GDP would have been up only 1.5%. In the case of trade, the growth was largely a function of declining imports – which resulted in an improved net trade number. Hardly a sign of strength. Meanwhile, inventory-driven GDP growth is temporary since inventories in one quarter are almost always often worked down in subsequent quarters as businesses scale back their production to reduce those excessive inventories.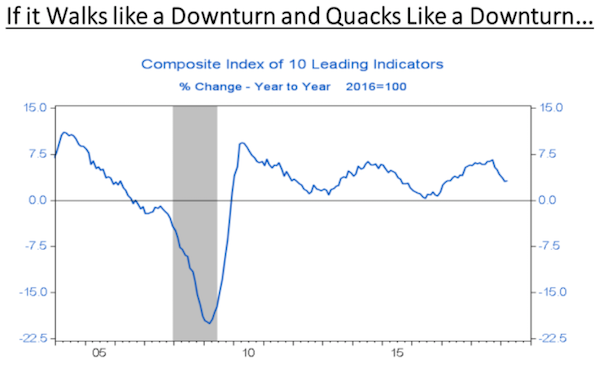
In any case, neither component is a vote of confidence in underlying demand in the U.S. economy, which showed some serious cracks in the first quarter. Personal consumption was up just 1.2% – its weakest quarter since the middle of 2013. Even more concerning, though, are the scars from the U.S. Federal Reserve’s interest-rate increases of the past two years that are plainly visible in this report. While not yet down to levels which suggest an imminent recession, the chart below shows how leading indicators have clearly turned down in the past year.
The NY Fed recession risk model sees the probability of recession in the next 12 months at 30%, the highest level since September 2007, just three months before the economy fell into recession. The bottom line, in our view, is to understand that monetary policy works with lag of about 12-18 months. What is currently in the system now is nine interest rate increases in the U.S. in the past two years and a 15% reduction in the Fed’s massive US$4.5 trillion balance sheet. Those moves will have a bigger and more immediate impact on the economy than the fact that Fed got ‘dovish’ on further rate cuts this year. There is growing evidence of this as the “rate-sensitive segment GDP” – a measure puts together of the components of U.S. GDP that are most sensitive to interest-rate changes – fell 2.9% annualized in the first quarter. It’s the first negative reading for those components – home construction, spending on durable consumer goods and business investment in equipment – since 2009.
While stocks investors have been celebrating, the bond market definitely sees the outlook with a much more jaded view. The ‘shape’ of the bond yield curve has always been an accurate indicator of coming economic weakness. A narrowing of the spread between short and long-term interest rates (or a negative number at the extreme) is a consistent indicator of slower growth. The chart below shows how this spread has been narrowing over the past few years and is now approaching negative levels sign prior to the last two recessions, as the yield on 10-year government bonds drifts lower at the same time as central banks were raising short-term interest rates.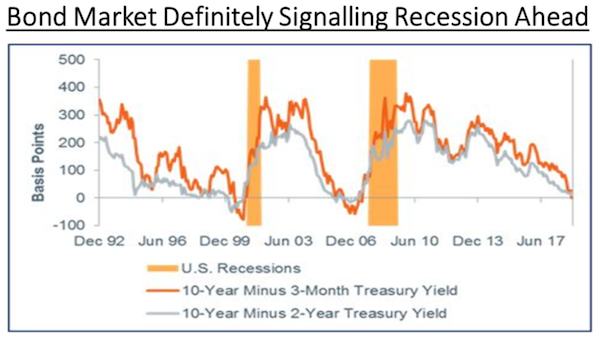
1 2
Our investment management team is made up of engaged thought leaders. Get their latest commentary and stay informed of their frequent media interviews, all delivered to your inbox.