Keep connected
Our investment management team is made up of engaged thought leaders. Get their latest commentary and stay informed of their frequent media interviews, all delivered to your inbox.
John Zechner
August 1, 2018
U.S. stocks pushed forward in July despite the late-month meltdown in some big-name technology stocks. For stocks overall, we have seen a continuing slow recovery off the early February low, driven in large part by the impressive corporate earnings reports and strong economic growth. While all the rhetoric around impending ‘trade wars’ instigated by the U.S. President have lead to heightened market volatility, investors have yet to factor in the potential downside to growth if these threats become reality. The backdrop continues to be the buoyant U.S. growth and confidence in the benefits of the tax cuts. But while stock markets in the U.S. appear to be grinding upwards toward their old highs, the fixed income, developing economy stocks, currency and commodity markets are telling a completely different story about the outlook for the global economy. Emerging economy stock markets have been under pressure, falling over 16% this year with China leading the downturn (down over 20% since February highs). Emerging market currencies have also been under severe pressures, which has lead to rampant inflation in sinking economies such as Venezuela and Turkey. Those breakdowns are very reminiscent of the emerging markets currency crisis back in 1997. The bond market is also painting a very difference picture. If the outlook for economic growth is so strong then why has the U.S. 10-year bond yield has stalled in the 2.8-2.9% range despite continued increases in U.S. short term interest rates? This ‘yield curve flattening’ has in the past been a harbinger of slower growth ahead and is generally a bad economic sign and suggests that the growth outlook is not as strong as the US stock market bulls would have us believe. Ditto for the weakness in most commodity markets as well as the US financial stocks. U.S. profit growth, in our view, is peaking in current quarter, as the impact of tax cuts wears off in the second half of the year. Moreover, rising input prices including higher wages, interest rates and basic materials will also begin to crimp profit margins. The net result of these diverging views is that global stocks have lagged the strength in the U.S. market and are now trading at their largest discount to U.S. stocks on record (28% lower, as shown in the chart below). 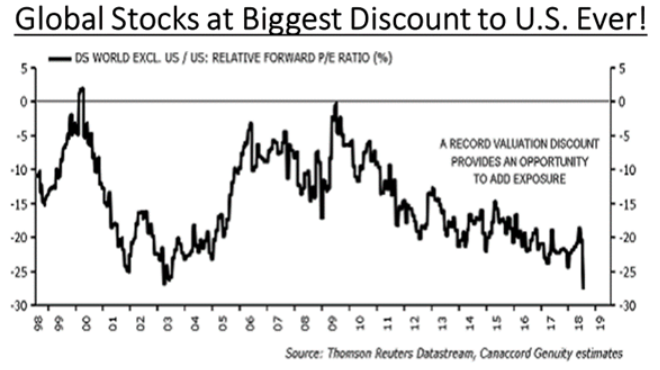
One has to wonder why there is such a disconnect? Is Dr. Copper” reading from a different playbook? Moves in copper prices have always been a very good lead indicator for global growth, hence the evolution of the term “Dr. Copper” as a reference to how well the price of the red metal has done in forecasting forward growth through its price movements. Yet another contradiction to the bullish global growth outlook! The chart below shows the sharp drop in copper prices in recent months.
Is the collapse in copper a sign of slower growth in China, slower global growth or is it just an unwinding of large positions in the metal by some key financial players? Copper prices reached their lowest levels in a year amid concerns that a global trade war could strain global supply chains and slow down the global economy. The slide has become a rout as momentum-chasing funds pile in on the short side. London Metals Exchange brokers estimate that the collective speculative short position had reached 18 percent of open interest, a level not seen since 2016. But it’s a fund of another kind that has grabbed the market’s attention. Few outside China will have heard of Gelin Dahua Futures Co. Ltd. But the Shanghai copper market has been tracking its massive bull position since July of last year. Recently it sold out of that position big time, coinciding with the collapse in the Shanghai copper price. There are echoes of January 2015, when another Chinese player, Shanghai Chaos, was linked with a copper price implosion. The metal was also approaching bear-market territory as it traded nearly 20% off its 52-week high. Copper had shot up over 30% last year as investors bet on synchronized global economic growth around the world.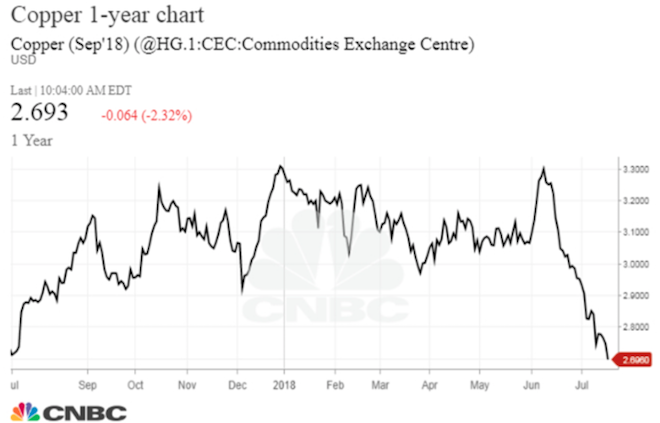
When it comes to explaining stock market moves, it’s always insightful to look at the flows of funds into new creations of exchange traded funds (ETFs). What “Follow the Money” Trends have we seen in the past year and how have they impacted financial markets? U.S. stocks have been rising on continued strong money flows into the market, but we have seen less money going into financials this year and continued large flows into large U.S. tech stocks. The ‘FANG’ stock have basically been the ‘only game in town’, although this too might be in the process of going through some changes. This narrowing breadth is reminiscent of past late cycle stock market flows (i.e. the ‘nifty fifty’ of the late 1960s). The table below shows the flow of new investment funds into various asset categories last year and so far in 2018.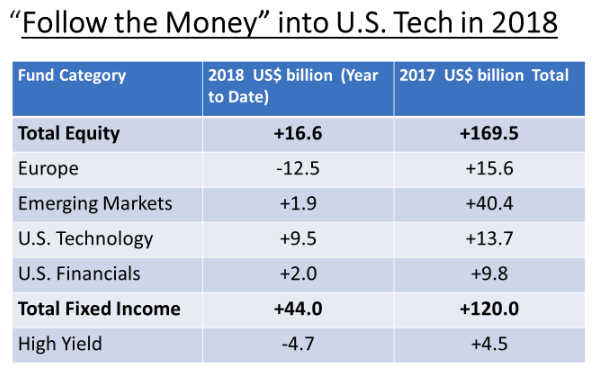
We have also seen much less money going into emerging markets (under $2 billion this year versus over $40 billion in 2017). Europe has taken the biggest hit though, most likely due to the rising political and trade issues with the U.S.
1 2
Our investment management team is made up of engaged thought leaders. Get their latest commentary and stay informed of their frequent media interviews, all delivered to your inbox.