Keep connected
Our investment management team is made up of engaged thought leaders. Get their latest commentary and stay informed of their frequent media interviews, all delivered to your inbox.
John Zechner
June 29, 2023
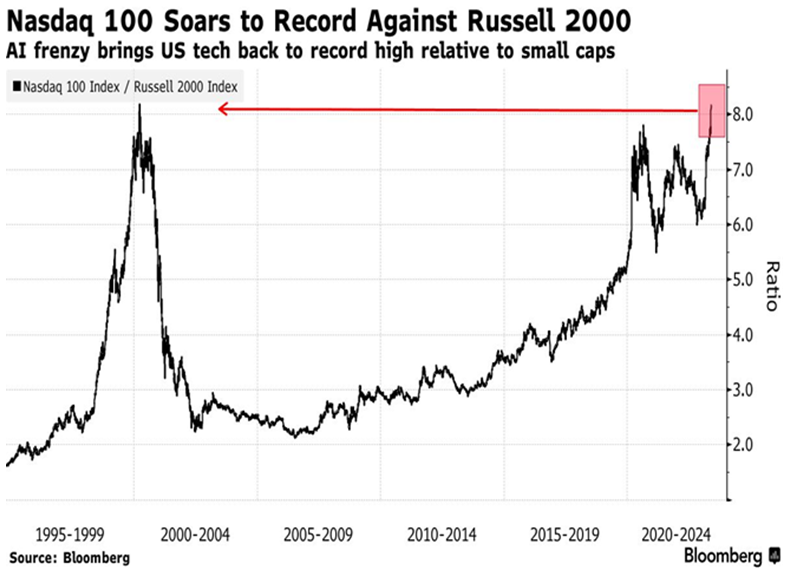
While 2022 finally gave ‘value’ investors a decided win over ‘growth’ investors for the first time in almost a decade, 2023 has reverted to the old playbook, despite the continued rise in interest rates, which is typically a headwind for high multiple growth stocks. After some broad-based strength in January got he year off to a great start, we saw a February sell-off which bled into March and then the regional bank crisis caused by the collapse of Silicon Valley Bank. The subsequent recovery in the stock market has been lead almost solely by the mega cap technology stocks, leaving most other sectors behind. The numbers bear this out: from the end of January through to today the S&P500 Index is up 7.7% and the technology-heavy Nasdaq Index has risen 17.5%. During that same period, Canada’s S&P/TSX Composite Index is down 4.7%, with eight of the eleven sectors showing losses. Only the Technology sector, along with the very defensive Consumer Staples and Utilities sectors have managed to eke out gains. Bank stocks have an almost 31% weighting on the TSX, much bigger than tech’s impact on the S&P500. Canada is very heavy on banks, metals, energy and gold mining stocks, which have all been out of favour as tech rallied around the globe. The chart below shows the ratio of the Nasdaq 100 to the broadly-based Russell2000 Index, which is loaded with financial, consumer and industrials stocks that all have economic sensitivities. That ratio has moved to a record level this year, eclipsing the highs seen at the peak of the internet ‘bubble’ back in 2000. While we can argue that the valuation of the technology sector is more solid and cash generative than it was in the nascent days of the internet stocks of the late 1990s, the similarities are compelling!
The anomaly of stock market strength at a time of reduced liquidity and higher interest rates reinforces views that FOMO (Fear of Missing Out) may be the primary driver of recent buying activity. The ‘momentum-chasers’ are out in full force. The Investors Intelligence Survey showed the ‘Bullish Camp’ rising to 53.4%, the highest since November 2021. The peak in the market was barely over a month away at that time, which is why this is a bellwether contrary indicator. The ‘Bear Share’ slipped a point to just 20.6%, and this is the lowest figure since early-January 2022, when the S&P 500 began to roll off its peak and embark on a ten-month 25% drawdown. Now that is the poll of professional investors. What about the general investing public? The American Association of Individual Investors survey (AAII) also showed a 16 percentage points jump in the bullish crowd over the past two weeks, which took the share up to 45.2%. Similar to the professional investor reading, this was also the highest reading since November 2021. The Bear Share fell 1.6 percentage points last week and is at the smallest level since July 2021. Adding to this mix is the CNN Fear/Greed Index, which shifted further into the “Extreme Greed” part of the sentiment pie at 82 versus 77 a week ago and 58 just one month ago. These are all classic signs of a stock market that is priced for good news only. This all suggests that investors have few concerns about rising interest rates and slowing economic activity.
Stock investors received little encouragement from central bankers as they continued their fight against high inflation. The U.S. Federal Reserve Board voted to leave its key interest rate unchanged at its June monetary policy meeting, marking its first pause after 10 consecutive rate hikes, which had taken rates up by 500 basis points. Rising interest rates and tighter liquidity can sometimes be offset in the stock market by rising earnings estimates, as we saw in the expansionary period of 2003-2007 period and again in 2015-2017. But that is not the case here, as estimates are down for both U.S. and non-U.S. equity indexes compared to the estimates at the market lows last October.
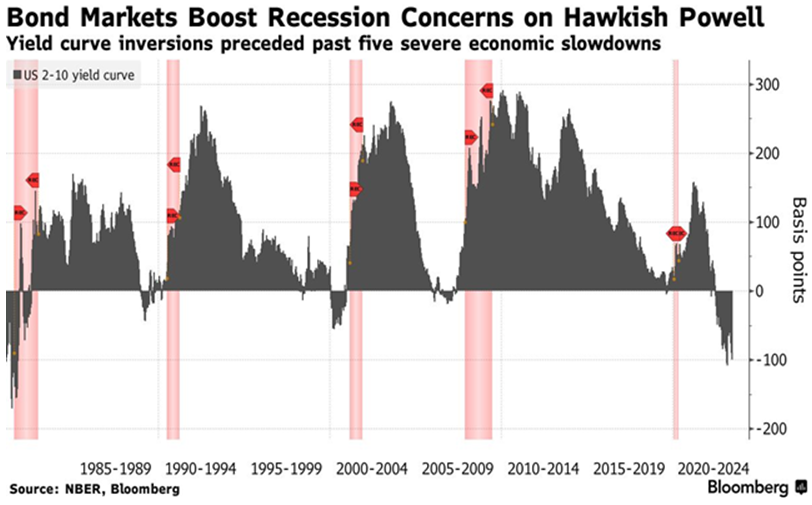
As money managers the question we most get asked by clients and others is “where do you think the market will be a year from now?” While we constantly see S&P500 targets from most big name strategists, the past year and a half should remind us once again how unpredictable investor behaviour can be and, even if we had forward economic and central bank information, market circumstances are not consistently forecastable. If we had known at the beginning of 2022 that interest rates would rise 500 basis points from zero, most investors would have expected the markets to be down over 25% and the economy to be in outright recession. While stocks did sell off sharply last year, the economic resilience has been impressive as has the stock market recovery, particularly in those high growth sectors that got hit so hard in 2022. But we continue to believe that we have not ‘revoked the laws of economics’ and that we have much slower economic growth in front of us. One simple economic realitiy is that rising short-term interest rates slow down economic growth, but the timing of these impacts is tough to determine accurately since these rate poliices work with ‘long and variable lags.’ But rising short-term interest rates (i.e. inverting the yield curve’) has been a consistent lead indicator of impending economic weakness. The chart below shows how the yield curve has correctly forecast every recession over the past fourty years (and probably further back than that). The current inversion has been the sharpest since the early 1980s when short term rates went ot double digit levels.
1 2
Our investment management team is made up of engaged thought leaders. Get their latest commentary and stay informed of their frequent media interviews, all delivered to your inbox.