Keep connected
Our investment management team is made up of engaged thought leaders. Get their latest commentary and stay informed of their frequent media interviews, all delivered to your inbox.
John Zechner
July 2, 2019
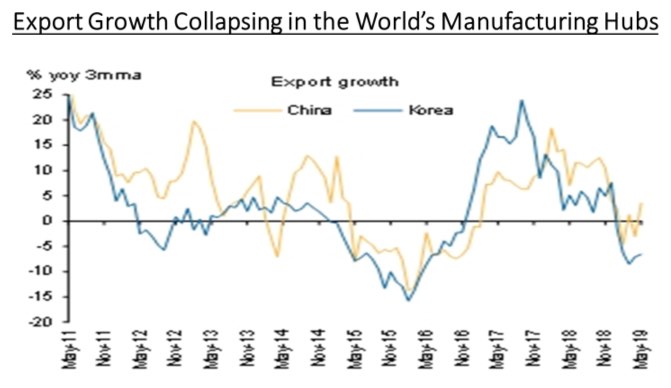
Our ongoing litany of poor global economic data points continues with recent results showing German industrial production down 1.9% in April (worst in 5 years), Euro Sentex Index of business sentiment down to a 9-year low, the JPMorgan Global Manufacturing Index down to a 7-year low, China’s Caixin Composite Index sagging to contraction territory and the Citi Global Economic Surprise Index showing the longest stretch of time ever in negative numbers! Export growth has also gone negative in the key manufacturing hubs in the world, China and South Korea (shown below).
One of the worst areas for stock performance in the past year has been in the energy sector, despite the sharp rise in crude oil prices so far in 2019. Once again, we have been shown that one of the most important conditions to pay attention to in forecasting oil prices is not always the true demand-supply conditions for the commodity as much as the recent behaviour of financial players in the industry. Hedge-fund managers have been liquidating bullish oil positions at the fastest rate since the fourth quarter of 2018 amid increasing fears about the health of the global economy. Hedge funds and other money managers have sold a total of 290 million barrels of petroleum in the past six weeks, after buying 609 million in the previous 15 weeks. Portfolio managers still have an overall bullish position of 621 million barrels, but that has been reduced sharply from a peak of 911 million on April 23. Hedge-fund long positions now outnumber short positions by a ratio of 4 to 1, down from almost 9 to 1 on April 23, according to an analysis of exchange and regulatory records. Mounting fears about a possible recession in the United States and around the rest of the world have outweighed continued output restraint by Saudi Arabia and disruptions to exports from Russia, Iran and Venezuela, pushes prices back down into the low 50’s range before recovering slightly amid growing hopes of a cut in interest rates by the U.S. Fed. We continue to like the risk-reward trade-off for the energy stocks though as continued geo-political issues in the Hormuz Strait and tensions between the U.S. and Iraq are supply-side risks that could easily push prices higher. Stocks are not reflecting the upside risks from those issues nor the strong cash generation that Canadian energy companies are beginning to deliver and return to shareholders.
While energy has been an area of disappointment, stocks in the technology sector continue to shine. Low interest rates and extreme optimism about the profit potential of a shift to cloud-based platforms and much higher data consumption have combined to push the entire group back up to all-time highs. However, the actual earnings growth has fallen far short of the optimism reflected in the stock price gains. The result is that valuations for the Russell 3000 Software Index relative to the S&P500 Index have risen to values not seen since the ‘tech bubble’ back in 1999. As seen in the chart below, the climb to these record values since the end of the Financial Crisis back in 2009 has been at a more gradual pace than in the ‘tech bubble’ years. 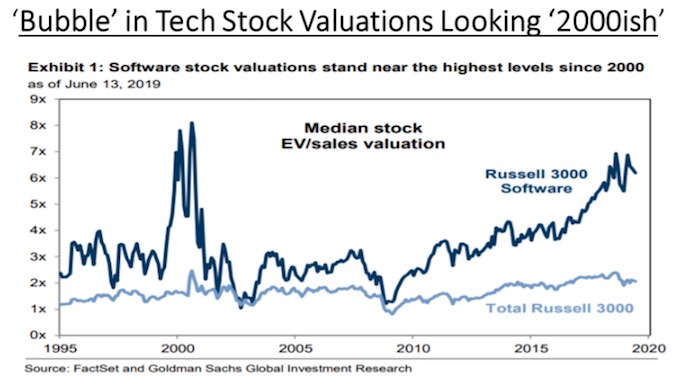
Finally, what we’ve tried to convey here is that the bullishness this year in the stock market contrasts with the message from the bond market, which is that growth is slowing significantly, and recession risks have increased to levels not seen in 12 years. But digging deeper into stock sector performance shows a less bullish view than investors might realize. Within the S&P500, the sector composition has a recessionary feel to it. Since first hitting 2,900 back in August of last year, the best-performing sectors have by far been the ones you want to own in a lower growth/lower rate environment – utilities, real estate, consumer staples and communication services. The sectors that have lagged the most were energy, materials, financials and industrials, with some of those experiencing outright declines while the stock market averages moved to new highs. If economic conditions were really improving, then we should logically expect those afore-mentioned cyclical stock groups to lead the market higher. Yet they are the laggards. So maybe the stock market and the bond market aren’t telling divergent stories after all!
While the stock market seems once again to be in a state of bliss, particularly in the U.S., we continue to see substantial risks due to slowing global growth, lofty earnings expectations and stock valuations that are only supported by the extremely low interest rate environment. In our view, the majority of market indicators are setting up for a period of volatility going into the third quarter. The seasonal return studies for both U.S. and Canadian stock indices show an elevated period of volatility and weaker return observations between July and September. Economic numbers and second quarter earnings are not expected to bring any good news either so markets will clearly be dependent on a lessening of trade tensions between the U.S. and China (amongst many U.S. trade battles) as well as continued conciliatory talk from key global central banks such as the U.S. Fed, the ECB and the Bank of Japan. Maybe that’s why gold and gold stocks have been shining a bit more brightly lately!
1 2
Our investment management team is made up of engaged thought leaders. Get their latest commentary and stay informed of their frequent media interviews, all delivered to your inbox.