Keep connected
Our investment management team is made up of engaged thought leaders. Get their latest commentary and stay informed of their frequent media interviews, all delivered to your inbox.
John Zechner
April 29, 2020
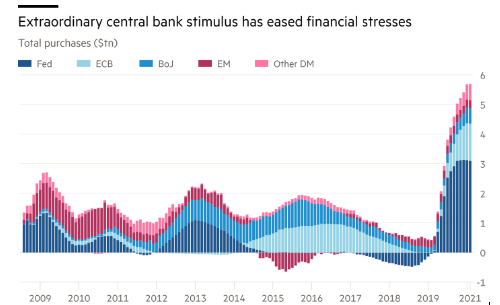
While the Covid-19 news has continued to grow more negative in the past month, with confirmed global cases numbering well over 3 million and deaths over 200 thousand, stock market investors have decided to look through the abyss and base decisions on an imminent recovery in economic growth supported by a long period of extremely low interest rates and other accommodative central bank actions. Despite U.S. job losses that wiped out the entirety of the gains since the Financial Crisis, stocks managed to post the two best individual weeks since the 1930’s. Investors are once again convinced that central banks will provide the fuel for further market gains, much like they did when they pumped liquidity into the stock economy via their QE1,QE2,QE3 and ‘Operation Twist’ programs following the financial crisis. The economic and earnings outlook suggest that the market should be lower, but the Fed is ‘putting their thumb on the scale’ in favor of the market. That stimulus was clearly needed to stop the massive liquidation in most financial markets in the first half of March. The Fed ‘did what they needed to do’ to put some floor under financial markets by providing well over US$2 trillion of liquidity from their balance sheet to buy debt, provide funding to banks and effectively ‘lubricate the financial system’ to stop it from breaking down. The chart below shows how aggressive these central bank actions have been in the past two months as well as plans for the balance of this year. The U.S. Federal Reserve has provided over US$3 trillion of liquidity to keep financial markets operating smoothly, taking their total balance sheet to over US$6 trillion. The European Central Bank, Bank of Japan, Bank of Canada and all other major central banks have undergone similar initiatives. That reversed a trend that had been taking place for the prior three years wherein central banks had been trying to slowly remove the liquidity they provided to get out of the 2008 Financial Crisis.
Phase One accomplished; financial markets stabilized and stocks started to rally. Now comes the harder part, which is to get economic conditions stabilized and hopefully start to get positive economic growth. That cannot occur until the virus spread is under control and new cases start to drop, which will probably take longer than the stock market bulls are counting on right now. In the meantime there is a pandemic-driven economic catastrophe of unprecedented speed has cost more than 26 million jobs in the U.S., which seems unreflected in an S&P500 index that’s up over 30% from its low a month ago, down a mere 16% from a record high just two months ago when the economy was at full employment and record corporate profitability. Many on Wall Street are remarking on this perceived Wall Street-Main Street disconnect. Yet the way the stock market has recovered doesn’t suggest that investors have rushed to anticipate a roaring economic revival. If stocks were handicapping such a quick resurgence in the economy, we would expect “early cycle” groups such as autos, banks, consumer durable goods and retail to lead the market. While those groups had suffered the largest decline in the initial selloff and did recover somewhat, the bulk of the gains continue to accrue to the larger, more defensive consumer staples, telecom, health care and technology stocks whose earnings are less likely to drop sharply, whose core business operations continue to operate in the shutdown and whose valuations benefit from continued low interest rates.
The recovery in stocks in the past month has been impressive, with the S&P500 recouping over 2/3 of their initial fall and even the TSX recapturing over 50% of its losses despite large sector weights in the weaker energy and financial sectors. While the economic data and the success of slowing the spread of Covid-19 will ultimately determine the direction of stocks, we cannot by any stretch of the imagination call this market cheap! The chart below shows the average of four core measures of stock valuation and it remains at levels exceeded only at the peak of the technology bubble. 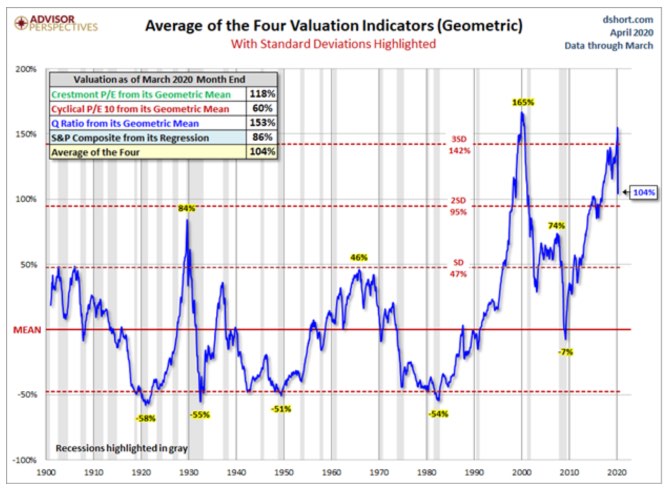
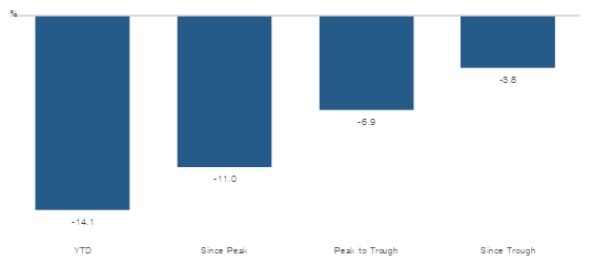
Another salient point about this recovery is to the degree to which it has favoured the larger stocks. This is somewhat logical to some degree, since those companies have the deeper financial resources to survive the downturn and the scale of operations to position for an eventual recovery. The larger companies also have global operations and may benefit sooner from earlier recoveries in China, Australia and Germany. The smaller companies tend to be more domestically-oriented and therefore more negatively impacted by the massive shutdowns in the U.S. This shows up within the S&P500 index itself. Since the index peaked on Feb. 19, its 100 largest stocks have dropped an average of 16%. The 100 smallest stocks in the S&P 500 have dropped 35%, nearly twice as much as the largest. The chart below shows the performance of the S&P500, which is populated with the major tech companies and other globally oriented business versus the Russell2000, which has a proportionately greater weight in domestic businesses, especially financial services, one of the weakest sector groups due to substantial loan-loss provisions and headwinds from low interest rates. The S&P500 is ahead of the Russell2000 by 14% year-to-date, dropped by 11% less in the initial sell-off and gained 3.6% more in the current recovery. The stock market world is really divided between the haves and the have-nots, and that will most likely continue as the economy deteriorates and profits are revised further down.
Our investment management team is made up of engaged thought leaders. Get their latest commentary and stay informed of their frequent media interviews, all delivered to your inbox.