Keep connected
Our investment management team is made up of engaged thought leaders. Get their latest commentary and stay informed of their frequent media interviews, all delivered to your inbox.
John Zechner
April 7, 2017
Stocks got off to a much better start in 2017 than they did last year when we saw the worst start to a year in stocks ever! While stocks did eventually show a good recovery last year after hitting the lows in mid-February, markets did experience trepidation in front of the U.S. election in November. However, as we all know now, the ‘surprise’ win by Donald Trump also lead to an unexpected rebound rally in stocks that carried market higher for the subsequent five months. The gain in stocks has been global as investors believe that the new U.S. administration will be able to recharge economic growth in the U.S. and that will spread to other economies. This would be in addition to the impact of the aggressive interest rate policies in Europe and Asia that were put in place to augment growth. The stock market rally has continued this year, lead by U.S., which had a strong first quarter thanks primarily to gains in the technology and financial sectors. European stocks also had a sharp rebound in the first quarter as the economic data has improved while worries about Brexit and other geo-political issues have subsided. The German Dax Index was up 7.2% in the quarter while France’s CAC40 pushed ahead by 5.4%. Some of the largest gains in the first quarter, though, were in the emerging markets, with the MSCI Emerging Markets Index gaining over 11%. India’s Sensex Index was one of the biggest winners, gaining over 16%. Weakness in the Energy sector held back Canadian stocks in the first quarter as the price of oil dropped despite the OPEC supply cut agreement. While the S&P/TSX did rise by 1.7% in the first three months of 2017, it was clearly hurt by a fall of over 9% in the Energy sector, which makes up about 20% of the index. Gold stocks were the biggest gainers in the quarter, with the TSX Gold Index up 8.1%.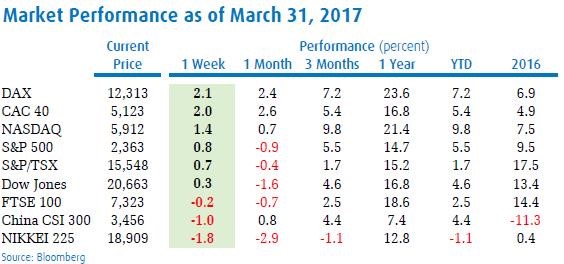
While stocks started the year off well, they did stall a bit in March, but certainly did not break down to any degree. Since it peaked on March 1, the S&P500 Index has failed to make new headway, but it’s off only 1.4% from that peak and it still closed up for a sixth straight quarter. Not since 1967 have we experienced a quarter as staid as the past three months, in which the index’s daily moves averaged just 0.32%. While the Dow Jones Industrial Average at one point closed down for eight straight days, it gave up just 1.9% over this slide. Anyone who calls that a “correction” probably thinks paper cuts are mortal wounds.
Much of the bullishness can be attributed to the potential new tax package coming in the U.S. But the Congressional Budget Office pointed out that, at 77% of gross domestic product, public federal debt is already at its highest level since World War II. Getting big tax cuts without adding further to record federal deficits will be an impossibility. That’s before we even start to consider the $1 trillion planned stimulus spending bill. In our view there will be more disappointments in terms of ‘policy promise failures’ to follow. At some point that will show up in stock prices since so much of the expected earnings gains this year assumes an aggressive tax package as well as stimulus spending. While stocks had a good first quarter as investors continue to chase the belief that the Trump presidency will lead to stronger economic growth, the failure to deliver on the Health Care Bill, the pushback on the spending and tax cuts as well as economic data that has yet to show any pickup made March a slightly tougher month for stocks.
But investors continue to wear rose-coloured glasses when looking at the data and seem more than willing to ignore risks such as policy shortfalls, geo-political risks, slowing global growth and record high valuations. While having a negative outlook on stocks has not been the ‘winning strategy’ since the U.S. election, we continue to look at the indicators from the market in terms of valuations and investor behaviour as support for our cautious view. While we could point to a plethora of charts that show how stocks are trading at extended valuations, we like to go back to the one shown in the chart below, which compares the value of the Wilshire 5000 Index to the level of U.S. gross national products. The long term value of this indicator has been around 80%, meaning that the value of the widest basket of stocks is trading at about 80% of the nation’s output of goods and services. While one could argue against the reliability of this indicator given that profit margins are higher than they have been in the past and global trade has become a bigger part of every economy, the reality is that this indicator is today trading at a value of 121%, not far from the all-time peak of 136% seen at the peak of the technology bubble and more than 50% above the long-term average.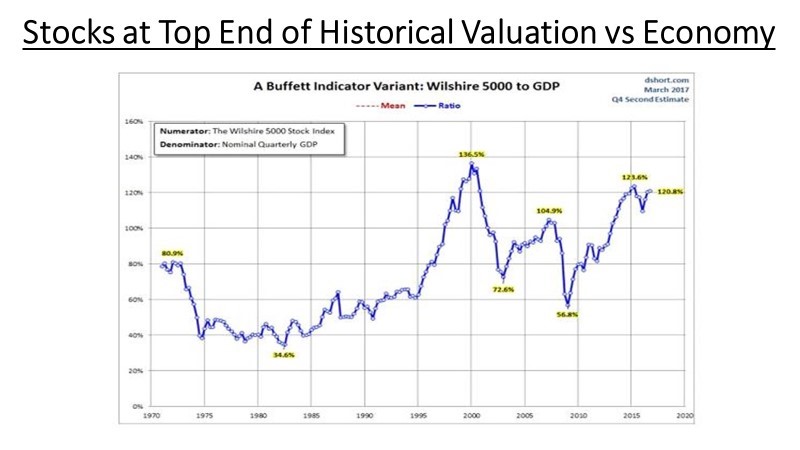
Our investment management team is made up of engaged thought leaders. Get their latest commentary and stay informed of their frequent media interviews, all delivered to your inbox.