Keep connected
Our investment management team is made up of engaged thought leaders. Get their latest commentary and stay informed of their frequent media interviews, all delivered to your inbox.
John Zechner
November 1, 2018
During October, stocks in North America had their worst month since the start of 2016, despite the sharp rally on the final two days of the month. The S&P/TSX Composite Index in Canada and the S&P 500 in the U.S. each lost over 7%, the Dow Jones Industrials Index was down over 6% and the Nasdaq Composite plunged over 10%, its worst month since October 2007. While the market appears very ‘oversold’ on a short-term basis we think that this decline in different from the February sell-off and is more indicative of the overall risk to stock markets that we have been wary of for many months now. While the February decline ended up being just another opportunity to ‘buy the dip’ for further gains, the current pullback has been generated by a deeper set of problems that we expect to lead to further losses over the next year. The stock market decline in early February was precipitated by rising interest rates and some spreading fears that the U.S. Federal Reserve was about to become more aggressive on interest rates. But, at the same time, U.S. earnings were just starting to show the positive impact of the tax cuts and expected to grow in excess of 20% in 2018. Also, most investors and analysts were also buying on the premise that there was a ‘synchronous global economic recovery’ taking place that was setting an extremely strong backdrop for more earnings gains. Those beliefs are now being challenged as slower growth in Asia, the Emerging Markets and Europe and the impact of the trade wars and tariffs are starting to be felt by major global companies in the U.S.
Similar to the February decline, the current pullback was also precipitated by increased fears of more aggressive Fed interest rate policy, specifically the October 3rd comment from U.S. Fed Chairman Jerome Powell that U.S. short-term interest rates were ‘a long way from neutral’. But then we started to get earnings reports in the U.S. which, unlike the prior few quarters, failed to provide the buoyant outlook that investors were looking for. With 48% of companies reporting, quarterly earnings are up 22% from the same period a year ago. While that growth was strong, as expected, some corporate officials expressed worry about the road ahead, particularly concerning the impact that tariffs and rising interest rates will have on growth. While the offhand comment by Caterpillar CFO earlier this year that the first quarter might be the “high water mark” for earnings this year ultimately lead to a major sell-off across the board, the ‘catalytic event’ this time around, in our view, came on the earnings conference call from Texas Instruments. Given that TI sell across a multitude of industries including autos, telecom and industrials, the fact that they could not give accurate guidance for the balance of the year and pointed to weakening order trends over the past three months sent investors running for the exits, not only in other semi-conductor stocks but across all markets. Then we saw revenues from Amazon Inc. come up short of expectations despite a solid ‘bottom-line’ beat. The breakdown of Amazon, Netflix, Facebook and Alphabet lead the sharp losses for the Nasdaq Index and also signified the first real breakdown in these growth leaders in a number of years.
Markets never go straight down, so rallies will occur between now and year end, particularly as year-end tax selling ebates and corporate stock buybacks, which had been in a ‘quiet period’ during earnings reporting season, resume. Those buybacks are expected to hit record levels this year, reaching close to US$1 trillion. But we think there is a bigger picture issue that will weigh on stocks going forward. Rising interest rates have taken away the key liquidity support that had taken stock valuations higher over the past decade. We need to see some further compression in stock valuations and some reductions in 2019 earnings estimates before we get to a more ‘buyable level.’ The primary concern, though, remains stock market liquidity. The Fed and other central banks are tightening much more than most market participants expected. As short- and long-term interest rates normalize, equity prices are likely to return to historic price-to-earnings ratios. If the P/E ratio of the S&P 500 regresses to its historical average, 40% below today’s level, $10 trillion of household wealth would be wiped out. The past relationship between household wealth and consumer spending suggests such a decline would reduce annual spending by about $400 billion, shrinking gross domestic product by 2%. Add in the effects on business investment, and this spending crunch would push the economy into recession. If a recession hits in the next few years, the Fed will not have any room to cut rates, despite any ‘egging on’ from the current U.S. Administration. There also won’t be much room for a major fiscal intervention. Federal deficits are expected to exceed $1 trillion annually in the coming years, and publicly held federal debt is predicted to rise from 75% of GDP to nearly 100% by the decade’s end. This means a downturn brought on in the next few years by rising long-term interest rates would likely be deeper and longer than the average recession. Unfortunately, there’s nothing at this point that the Federal Reserve or any other government agency can do to prevent that from happening.
The debt crisis is also not contained to only the U.S. The world debt/GDP ratio has risen to 244% versus the prior peak of 210% in 2007, before the Financial Crisis. Emerging markets have been responsible for the bulk of this growth, with debt increasing from $17 trillion in 2007 (15% of global total) to $54 trillion in 2017 (30% of global total). In a world of record low interest rates, the impact of that debt has yet to be fully shown, but we are starting to see some market indicators that are reflecting that risk, including the U.S. Credit ETF, shown in the chart below.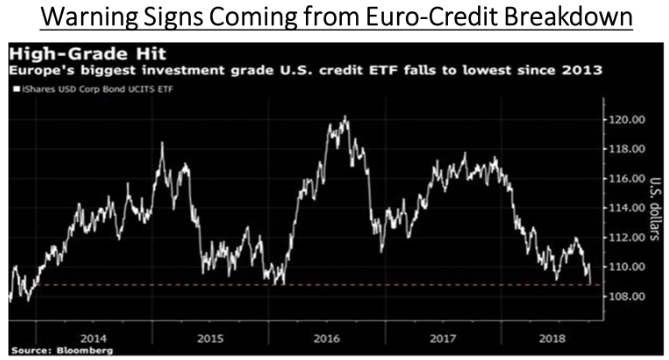
The economic background south of the border remains strong right now. The U.S. economy is growing at a healthy pace, the labor market is its tightest in years and consumer confidence hasn’t been this high since 2000. But one warning sign of trouble could be flashing in the housing market. The ECRI leading home price index has made a downturn that it hasn’t made in a long time. The last time it was this weak was in 2009, coming out of the last recession, and this leading index in 2006 called the housing bust. Falling home prices are not just a problem for the housing market; they could easily spill over onto the broader economy. The link goes through the ‘wealth effect’, referring to the behavioral economic theory that consumer spending increases when perceived wealth increases. Declining asset prices such as real estate have a negative wealth effect. The bigger problem for U.S, growth is that it is ‘hitting the wall’ in terms of employment levels that have marked economic peaks in past cycles. As shown in the chart below, anytime that unemployment has reached these levels in the past, wage pressures start to emerge, interest rates and inflation increase and the cycle comes to an end. Gray areas in the chart represent periods of economic recession. Unless we are suddenly in a ‘new economic normal’, this data suggests we are on the verge of an economic slowdown in the U.S. Since stocks always peak in advance of peaks in economic growth, we have to wonder if the current sell-off in stock is another indicator that the cycle is winding down.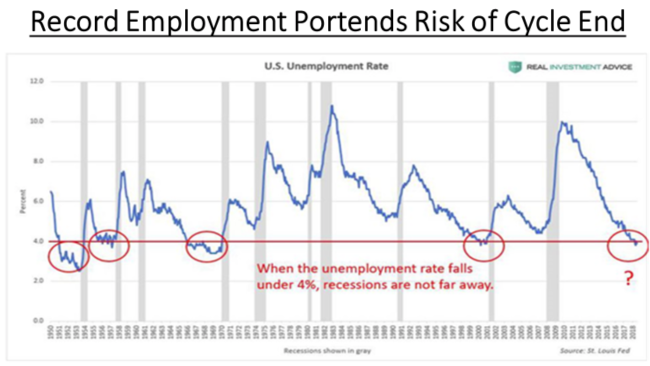
1 2
Our investment management team is made up of engaged thought leaders. Get their latest commentary and stay informed of their frequent media interviews, all delivered to your inbox.