Keep connected
Our investment management team is made up of engaged thought leaders. Get their latest commentary and stay informed of their frequent media interviews, all delivered to your inbox.
John Zechner
November 5, 2019
While big money flows and the new ‘algorithmic trading’ strategies have dominated the upward move in stocks over the past few years, the chart below seems to show that retail (individual) investors have not been as enamoured by the bullish views. Investors in both mutual funds and ETFs have been switching from stocks into bonds since the 2015 downturn, at an annualized rate of almost US$200 billion. Maybe the reversal of those funds back into stocks will finally make the ultimate market highs for this cycle; or maybe the public’s skepticism will turn out to be accurate! 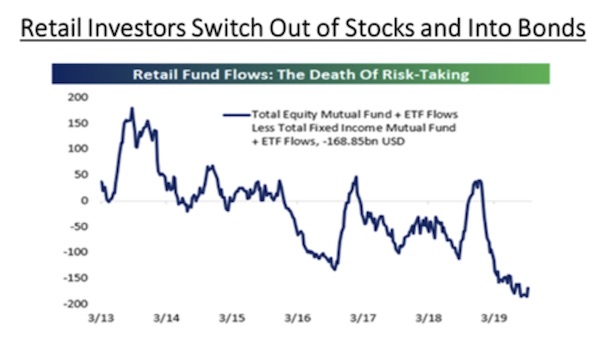
Another factor sustaining the bull market over the past ten years has been the consistent growth in stock buybacks. In very simplistic terms we have effectively seen over $4 trillion in total stock buybacks that was primarily financed by an issuance of over $4 trillion in corporate debt. In the end it’s all about supply and demand, and these buybacks reduced the share count overall to a two-decade low at the same time as the lack of alternatives pushed more funds into stocks and pushed up their valuations. Welcome to the world of financial engineering created by zero interest rates!
Is technical analysis losing its value in these times of passive investments and algorithmic trading? I have followed many of the Elliott Wave theorists and other technical trading models for decades, but in the past few years many of these technical models have not been working so well. This is most likely due to the growth of quantitative/algorithmic trading and other passive investing flows, which are mostly driven by computer models, and which now dominate market volumes and shorter-term moves. Once we take active, emotional decision-making out of the investment process, technical analysis seems to be losing its value since the heart of technical analysis is trying to quantify and forecast market moves using historical trading patterns. In this new environment, we expect that most active investors will need to spend more time looking at passive money flows etc. to get a better grip on macro trading. It seems like the advent of negative interest rates, algorithmic trading and passive funds is making many long-time investors have to throw out the old playbooks.
While we have been positive on the outlook for gold for the past year, we did enjoy getting some re-affirmation on this view during an update on the gold market 30-year review with industry icon Pierre Lasonde. Some of the key points he mentioned were that Central banks went from being net sellers of gold to net buyers. In 1989, Central banks were net sellers of gold (432 tonnes) versus net purchasers of 657 tonnes in 2018. China, Russia, Asian, and Middle Eastern central banks have all been increasing their gold exposure. There has also been an increase in investment demand through Exchange Traded Funds. Gold ETFs first became widely available to investors in 2004 and greatly increased investors’ access to physical bullion exposure. ETF demand today is at a similar level to 2013, when the gold price was ~$1,900/oz. Today ETF demand represents approximately one-third of the market capitalization of all gold mining companies. Gold demand has also moved from West to East. In 1989, China and India made up ~10% of global gold demand but today make up ~53%. The U.S. and Europe are no longer the drivers in gold demand. China’s central government encourages the banks to promote gold bullion to investors who would rather own gold than the yuan. Pierre expects demand from these two countries to increase to over two-thirds demand over time and expects that the Shanghai Exchange will overtake London and New York as the primary exchange for trading bullion should the yuan freely trade and not pegged against the U.S. dollar. Bottom line, we continue to see gold prices topping US$2000 per ounce over this cycle, especially as U.S. economic growth slows down and the dollar comes under pressure due to excessive debt.
1 2
Our investment management team is made up of engaged thought leaders. Get their latest commentary and stay informed of their frequent media interviews, all delivered to your inbox.