Keep connected
Our investment management team is made up of engaged thought leaders. Get their latest commentary and stay informed of their frequent media interviews, all delivered to your inbox.
John Zechner
October 3, 2024
Following the sharp sell-off and subsequent recovery in stocks in August, investors were noticeable nervous as we headed into September, historically the worst month for stocks. While the market got off to a rough start again in the first week, it was straight up after that as the Federal Reserve’s jumbo-sized rate cut and the promise of more easing to come reignited hopes for a soft landing for the U.S. economy. Meanwhile, as further fuel for interest rate cuts, inflation pressures continue to recede with the core measures approaching the Fed’s target of 2%. Investors got even more fodder for the new, more dovish outlook at the press conference following the September meeting, where Federal Reserve Chair Jerome Powell unveiled his latest buzzword to describe monetary policy, with a “recalibration” of policy at a pivotal moment for the central bank. At the news conference, Powell used variations of the word no fewer than eight times as he sought to explain why the Fed took the unusual step of a half percentage point rate cut absent an obvious economic weakening. “This recalibration of our policy stance will help maintain the strength of the economy and the labour market and will continue to enable further progress on inflation as we begin the process of moving forward a more neutral stance.” That was all that investors needed to hear and stocks then rallied sharply in the last two weeks of the month. Investors got an additional boost when the PBOC (Peoples Bank of China) came through with a massive stimulation program using both monetary and fiscal triggers to help lift the Chinese economy out of its slowdown and provide some support for their faltering housing market. Those announcements sent stocks surging as Hong Kong and Shanghai stock markets rallied over 17% each on the month. However, Japanese and South Korean stocks did not join in the rally as currency strength in the Yen undermined the ‘Yen-carry’ trade once again. Ongoing economic weakness in Europe, particularly in the auto sector, limited gains in European markets.
The latest data show that the annualized three-month core PCE is currently running below the Fed’s 2% inflation target. It should help erase any doubts that the Federal Open Market Committee made the right call when it slashed benchmark interest rates by a half percentage point. The only surprise, in our view, was the sell-off at the long end of the bond market. However, we see that as only a ‘knee jerk response’ since the history of all Fed easing cycles is that only half the bond rally is over at the time of the first rate cut, including all recessions and all soft-landing periods. That is good news for long-dated Treasury securities, rate-sensitive stocks, and gold.
Investors have clearly turned exceptionally bullish again with sentiment indicators rushing back up towards the July highs. Equity inflows last week were the largest they had been in roughly two years, according to Bank of America Securities. The Wall Street bank reported its clients snapped up $6.9 billion worth in stocks, the highest level going back to October 2022. Traders bought up stocks after the Federal Reserve’s supersized rate cut bolstered investor optimism last week. Investors need to take this level of exuberance into account when looking at adding equity exposure. New money into the S&P500 today is paying 21.6-times projected earnings over the next 12 months, only a smidge below the 21.8 multiple at the prior market peak in mid-July which gave way to a couple of sharp pullbacks and a bumpy rotation out of mega-cap tech leaders. The notion that the valuation excess is all in the Magnificent Seven giants isn’t quite right as well since the other 493 stocks as a group sit above an 18 multiple.
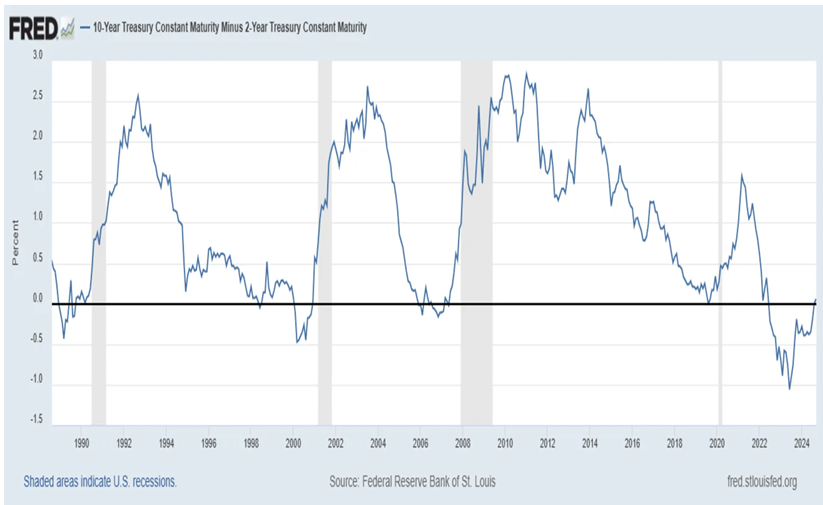
The biggest surprise this year, in our view, has been the ongoing resilience of the U.S. economy in the face of the substantial rise in interest rates in 2002-23 and the slowdown elsewhere across the globe. In macroeconomics, the yield curve is used to forecast the probability of a recession. This is shown in the chart below which shows the difference between 10-year and 2-year Treasury rates in the U.S. When the curve becomes inverted, it means that short-term yields are higher than long-term yields which, up until last week, had been the case for over two years. This puts investors on edge because an inverted yield curve has historically given way to recessions. Looking back 40 years, there are only three prior occurrences where the yield curve turned positive after a prolonged period of inversion: 1989, 2000, and 2007. Those three occurrences all led to recessions. While these classic indicators have appeared not to work so far in this cycle, we think there were a lot of other ‘unique’ factors in play, almost all tied to the policies coming out of the pandemic, that kept growth ‘stronger for longer.’ We don’t expect those impacts to last and continue to believe we will see a slowdown in growth in the U.S. driven by worsening employment conditions, even with the expectations of a sharp drop in interest rates over the next year. The yield curve says we are headed for a significant economic slowdown.
But a severe U.S. recession remains highly unlikely since U.S. Federal fiscal deficits continue to run at 7-8% of GDP and neither political party likely to win the upcoming U.S. election has indicated a desire to cut back on fiscal spending or raise taxes to improve the debt outlook. Meanwhile, Baby Boomers continue to engage in “the world’s biggest YOLO spending binge” (You Only Live Once) financed by their ~$114 trillion of assets that have rallied in the past two years.
The wealth effect is clearly a major driver of consumer spending, primarily because stock market valuation in the U.S. is at a record 140% of GDP. Global economic trends: Over the past quarter of a century, economic performance in the major industrial economies has diverged significantly, with GDP expanding by a cumulative 87% in Australia, 63% in the US and 28% in Germany. That comparison is of course heavily impacted by differences in population growth. However, even on a per capita basis we have seen a significant divergence, with U.S. output up 36%, Australia 32%, Germany 23%, the UK 21%, France 18% and Canada 16% since 2000. Unsurprisingly, the main driver has been a divergence in labour productivity, with annual U.S. productivity growth since 2018 averaging a healthy ~1½% compared to just 0.7% in the UK, 0.6% in Canada and 0.5% in Germany. While it is difficult to isolate the precise drivers, a key factor in recent years looks to have been higher U.S. business investment as a share of GDP, particularly in tech sector R&D. Demographic differences have also impacted GDP per capita growth, with the drag on U.S. growth from the ageing of the population less than seen in Europe. Finally, while industrial production has stagnated in the advanced economies over recent decades, Chinese competition looks to be having an increasingly large impact on European output, with German production now nearly 20% below its 2017 peak. The net read on all of this in terms of the impact on stock markets suggests that technology stock will continue to be leaders, both in terms of earnings growth as well as their ability to improve productivity in other sectors. This should also act to limit inflationary pressures, assuming of course we don’t get the type of production disruptions seen during the pandemic.
Where will all that ‘cash on the sidelines’ go? Retail investors’ assets in money market funds have grown by over $950 billion since 2022, when the Fed started its rate-hiking cycle to tame inflation, according to the Investment Company Institute, which represents investment funds. Their assets currently stand around $2.6 trillion, roughly 80% higher than at the beginning of 2022. Total money market assets are at $6.3 trillion. The most bullish outlook for the stock market assumes that these money-market assets will move to other financial markets, especially the stock market. That argument is very debatable in our view, since the largest source of the growth in money market funds came from bank deposits. When interest rates were near zero, it mattered very little to depositors at banks that their savings and checking accounts were getting basically no interest income. However, once rates began to rise sharply, the opportunity cost of low deposit rates became more pronounced, so these bank deposits shifted into GICs and money market funds. It is quite a stretch to believe that those same investors are going to move fully to the higher risk environment of stocks, particularly the high growth/ high valuation sectors. The more logical initial path is that these money market holdings become fixed-income holdings. Once interest rate lows are reached and there is little upside in fixed income or money markets, we could see a move into preferred shares or dividend-paying stocks. This trend, if it occurs, would help Canadian stocks close the valuation gap with the U.S. since the dividend opportunities are higher in our market. But we really need to pull back on this belief that there is $6 trillion of money market assets primed to make a major move into stocks!
One big winner so far in 2024 has been the gold market, as a falling U.S. dollar, expectations of a cycle of falling interest rates and continued buying by major central banks have combined to push the yellow metal well above the critical US$2000 level to a recent high of almost US$2700! Gold stocks have also started to finally reflect the bullishness seen in the metal itself. Whatever bullishness the equity returns reflect, gold’s performance suggests expectations that politicians will do whatever it takes to deal with the budget, inflation being the most expedient means by which to reduce the debt burden. Even before the steep economic downturn from the Covid pandemic, the federal deficit ran at 4.5% of GDP, a level previously associated with recessions, despite unemployment under 4% and a then-record stock market. Suppressing real interest rates further helps make the debt less burdensome. Trillion-dollar deficits loom as far as the eye can see. According to the outlook of the nonpartisan Congressional Budget Office, the deficit is projected to continue to exceed 5% of GDP for the rest of the decade, climbing to 6.1% by 2034. At that point, the U.S. could hit its sustainable gross debt limit, at over 150% of GDP. We expect all of this money issuance to put ongoing pressure on the U.S. dollar, which means more support for alternatives to the U.S. dollar, with gold being near the top of that list!
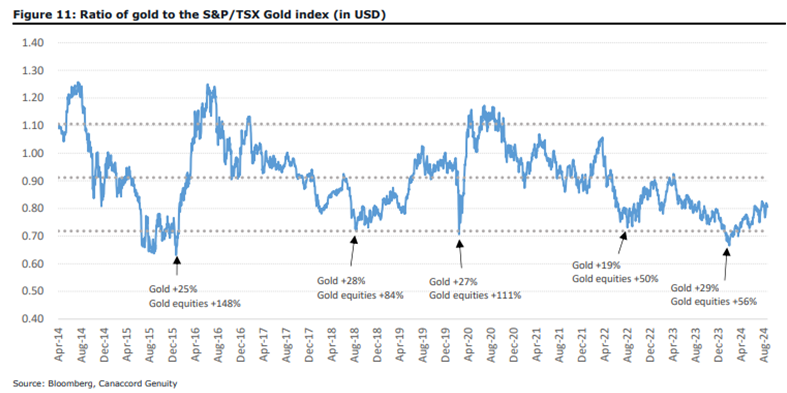
As can be seen in the chart below, gold stocks are still relatively undervalued, with the ratio of the price of gold to the indexed level of the TSX gold stocks touching an 8-yer low of 0.7 at the beginning of this year. This gap has begun to close in the past six months but remains near those lows.
We also still like stocks in the Energy sector for next few years as we believe the transition to electric vehicles and building of renewable energy facilities will be much slower than expected and fail to meet stated government targets. Investors have written off many fossil fuel stocks but we believe the infrastructure will not develop as quickly as expected to allow larger adoption of electric vehicles and therefore see demand for ICE (internal combustion engine) and hybrid vehicles staying ‘stronger for longer’. Demand will also be helped by continued higher growth in emerging economies. Energy stocks are exceptionally inexpensive using current oil prices and most are incorporating much more shareholder friendly policies such as buybacks, debt reduction and increased dividend payments which make stocks even more attractive. If investors don’t reward the companies then we would expect buyback and corporate activity to increase to fill the valuation gap. We also see good growth opportunities in the renewable energy stocks as there will be demand for these sources and the capital outlays are very ‘front end loaded’ meaning that, once the facilities (solar and wind) are built, the operating costs drop sharply and therefore the free cash flow increases substantially. This has yet to be factored into longer term valuations of the stocks.
In terms of overall investment strategy, we begin with the premise that there are no global catalysts for a resumption in growth. Massive fiscal deficits in the major economies (especially the US and China) and central banks that have already ‘pulled all of their growth levers’, leave little room for additional stimulus. The result is that growth should return to the low levels of the past decade. This means that interest rates will go down further and stay lower for longer, much like they did for the entire decade prior to the pandemic. This will provide a continued tailwind for elevated stock valuations, particularly in higher growth industries such as technology, and for high dividend yield stocks. Cyclical stocks in the industrial and consumer sectors will see lower earnings growth. This favours continued investment in those sectors that can exhibit growth (technology) as well as the companies that can pay out higher income via dividends (telecom sector, utilities, energy and financials).
A few stocks we added to in the past month and the reasons behind the moves include:
Veren Inc (VRN-TSX). Veren’s recent underperformance has resulted in an improved entry point as the market continues to underappreciate the potential free cash flow growth, value of asset optimization, and how much the overall business has improved since 2018. They have a completely revamped asset base, which is now 75% concentrated in high impact plays (Montney/Duvernay), long-term growth, inventory depth, return of capital, and modest financial leverage and trades at only 2.8 times operating cash flow multiple.
Lightspeed Commerce Inc. (LSPD-TSX) Lightspeed provides an easy-to-use omnichannel POS software platform. Its software enables retail and hospitality merchants to manage operations, accept payments and grow their businesses. Lightspeed’s platform is used at ~165K organic customer locations. Lightspeed’s shift in strategy should yield improved business plan execution and revenue growth, and expand adjusted EBITDA as F2025 progresses. Growth can come from higher subscription revenue. The announcement last week that they have engaged JP Morgan to look at strategic alternatives, including a sale of the entire company, should accelerate the realization of this undervaluation. Lightspeed trades at a ratio of 1.8 times 2024 enterprise to expected sales versus industry peers at ~5.5x times.
Atkinsrealis Group Inc. (ATRL-TSX). The former SNC-Lavalin Group Inc. is a professional services, and project management company. It delivers end-to-end services across the whole life cycle of an asset including consulting, and advisory and environmental services. ATRL’s core Engineering Services Regions and Nuclear segments are well positioned to continue realizing strong organic revenue growth and margin expansion. Top line growth is supported by robust backlogs and favorable demand trends, while management is focused on driving margin improvement in Engineering Services (~75% of TTM revenue). Nuclear segment is underappreciated in the current valuation and could see potential life extension of the Pickering reactors. Risks as always include possible cost overruns and/or cash outflows associated with LSTK Projects work, a weakening of end-market conditions or failure to deliver improved margins. But the valuation is attractive at 10.7x and 8.8x 2024/2025 adjusted EBITDA, a discount compared to Canadian engineering services peers.
Our investment management team is made up of engaged thought leaders. Get their latest commentary and stay informed of their frequent media interviews, all delivered to your inbox.