Keep connected
Our investment management team is made up of engaged thought leaders. Get their latest commentary and stay informed of their frequent media interviews, all delivered to your inbox.
John Zechner
June 28, 2017
We would feel somewhat more at ease about the high stock valuations if economic growth was actually starting to gain momentum, since that was much of the basis for the rally following the U.S. elections last November. But the reality appears to be falling far short of that expectation. The chart below shows the Citigroup Economic Surprise Indices for the U.S. (blue), Europe (grey) and Asia (red). These indices measure the actual data on key economic indicators versus their consensus expectations levels. While they are not measures of economic strength or weakness, they are a very good measure of data trends as they measure results relative to expectations. This is important since the consensus expectations are the ones that generally drive financial markets.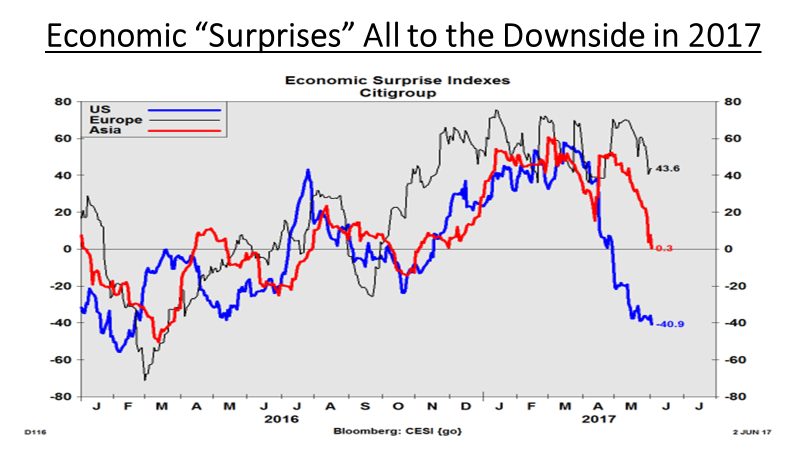
What is clear from the charts is that the numbers over the past few months have come in below expectations, particularly in the U.S. Clearly there were some buoyant expectations for economic growth in the U.S. following the elections, the so-called ‘Trump Trade.’ But a failure to implement promises on tax cuts, infrastructure spending, trade and health care has caused the numbers overall to come in well below expectations. While employment growth and consumer sentiment have been strong, economic growth was only 1.2% in the first quarter and looks like it will only be about 2% in the second quarter. On top of the downward trend in the U.S., growth in both China and Japan came in below expectations. While Europe has been stronger, the numbers have fallen somewhat short of expectations more recently. Maybe this shortfall in economic growth is what bond investors have seen and why bond yields have continued to track lower in the first half of 2017! While most investors expected bond yields to continue rising this year as growth picked up, inflationary pressures rose and central bank policy became less easy, bonds have confounded the consensus view by trading lower.
From the standpoint of creating economic uncertainty, the election of Donald Trump has been more tumultuous than the 1987 stock market crash and the 2008 financial crisis. Judged by the Economic Policy Uncertainty Index, the election of President Trump stands as the third-biggest source of uncertainty in the index’s 30-plus-year history. It is eclipsed only by the 9/11 terrorist attack and the battle over the fiscal cliff in 2011 in terms of generating doubt about future economic policy. The index measures the occurrence in newspaper articles of words related to economic uncertainty and politics, including the Federal Reserve, Congress and the White House. It also gauges the number of expiring tax laws and the spread among economic forecasts, suggesting that a greater dispersion of forecasts suggests more uncertainty. If nothing else, it has accurately pointed out the moments of major economic turmoil of the past three decades.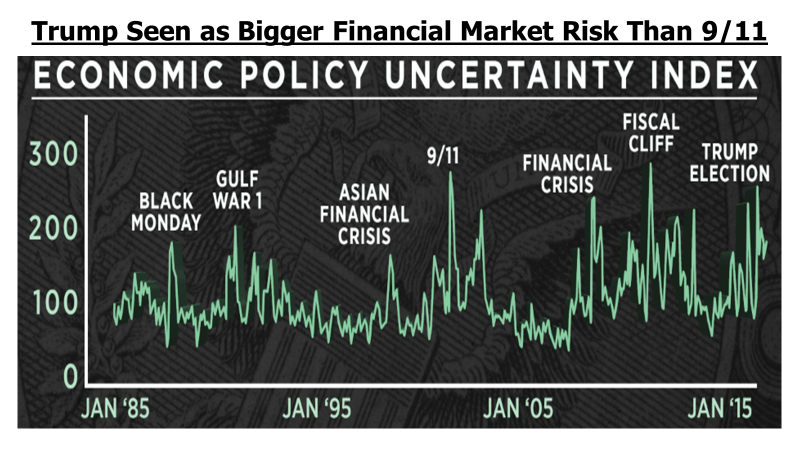
Our investment management team is made up of engaged thought leaders. Get their latest commentary and stay informed of their frequent media interviews, all delivered to your inbox.