Keep connected
Our investment management team is made up of engaged thought leaders. Get their latest commentary and stay informed of their frequent media interviews, all delivered to your inbox.
John Zechner
December 1, 2025
We have indicated recently that our investment strategy is very similar now to our ‘year 2000 playbook’, which was to stay defensive. We maintain sector overweight positions in health care, telecom and energy infrastructure. We have also kept long-term bonds as a hedge against stock market risk as well as economic weakness and also have been look for opportunities in stocks that have been leading tax-loss selling candidates. We did reduce exposure to the AI trade, especially high valuation stocks, semiconductors and the companies tied solely to expansion of data centres, such as Oracle and Celestica.
Surging Sports Valuations. CNBC published its NHL Team Valuations this week, ranking the Toronto Maple Leafs the most valuable NHL team at US$4.3B. The Leafs’ valuation is up 8% Y/Y, with CNBC noting that the Leafs took in $130MM in net gate revenue last season, the second most in the league. The Leafs also make about $45MM a year in local media rights, third most in the league. Media rights continue to increase in value as streamers and tech platforms, alongside legacy broadcasters, compete for the rights. Pretty good for a team which last won their league championship in 1867! We can only imagine the value if the team could actually win. No matter how you cut it, though, Rogers Communications seems to be the best play on the rising sports valuations as they now own 75% of Maple Leaf Sports and Entertainment, the Toronto Blue Jays as well as the Rogers Centre and ScotiaBank arena in Toronto.
The effects of the pandemic on practically everyone wiring their home as an office, propelled technology spending as a share of GDP to a new record of 7.5% back in 2020. The spending boom in the past two years on AI and related sectors (not just Hardware but tech services as well), has taken the ratio above that prior all-time high and it has now surpassed the bubble peak back in the late 1990s. Year-to-date, volume capex growth in the broad technology sector has outpaced the rest of the capital-starved business space by +2,000 basis points! We haven’t seen a resource allocation shift like this since the dotcom boom. The upward move in the line over time clearly shows why technology is and will continue to be a growth industry for the markets.

The China Risk. Another reason that global technology spending will continue to grow is because China has reversed their growth policies somewhat away from manufacturing and capital spending to technology and innovation. Beijing is turning sectors such as pharmaceuticals, semiconductors, and quantum computing into national strategic priorities and supporting them with heavy investment through subsidies and patient capital for research and development, as well as reforms that cut red tape. Bank of America estimates that China’s AI capital spending this year could total 600 billion to 700 billion yuan ($84 billion to $98 billion), with more than half coming from the government. The high-tech push is sure to put pressure on U.S. companies. Think of it as the second China shock of this century. Much as China’s heavy investments in sectors such as steel contributed to the hollowing out of basic manufacturing in the U.S. and elsewhere after its entry into the World Trade Organization in 2001, China’s new initiative challenges advanced industries that are drivers of developed economies. That was clear in the strong hand that Chinese leader Xi Jinping played in trade talks with the U.S. last month, using the country’s dominance in rare-earth minerals and processing as a weapon.
In terms of the economic data we have seen for most of 2025, the overall theme is one of resiliency in the face of disruption and uncertainty. Another example from this week’s slate of data is the American consumer as The Conference Board found that confidence fell sharply in November to its second-lowest reading in the past five years, with only this past April lower (during the reciprocal tariff chaos). The University of Michigan survey finds sentiment is even weaker. Yet there is a clear split between what consumers are saying, and what they are doing. The delayed retail sales report saw a decent 0.2% rise in September, with sales headed for an annual increase of around 4.5% this year. Early predictions on Black Friday tallies hovered around 5% year over year gains while auto sales are on track to top 16 million units in 2025, the best since 2019. Even the U.S. job market, which is widely accepted as softening, saw initial jobless claims quietly ebb to just 216,000 last week, matching a nine-month low. We will not get a full picture of the job market until the November employment report is revealed on December 16, so next week’s ADP and other upstarts will have to temporarily fill in some blanks ahead of the FOMC meeting on December 10th. These reports are likely to reinforce the message of cautious hiring and a generally soft job market. However, this does not seem to be holding back overall growth. Canada’s economy brushed aside recession fears with a sturdy 2.6% snapback in Q3 GDP growth. After stumbling hard in the second quarter, amidst the trade uncertainty, when GDP fell 1.8% annualized, the economy rebounded on a quick turnaround in net trade. While the much better-than-expected Canadian growth in Q3 is unambiguously good news, it does come with some “yes, buts”. For starters, the improvement in trade was driven by a steep drop in imports, and even those figures were a best guess by StatCan since they don’t have September U.S. trade data. Imports dropping more than exports do technically improve the GDP numbers since imports are obviously not produced domestically. But dropping levels of consumptions are clearly not a good sign overall. Moreover, growth in the 4th quarter has staggered out of the gate, with October GDP falling 0.3%.
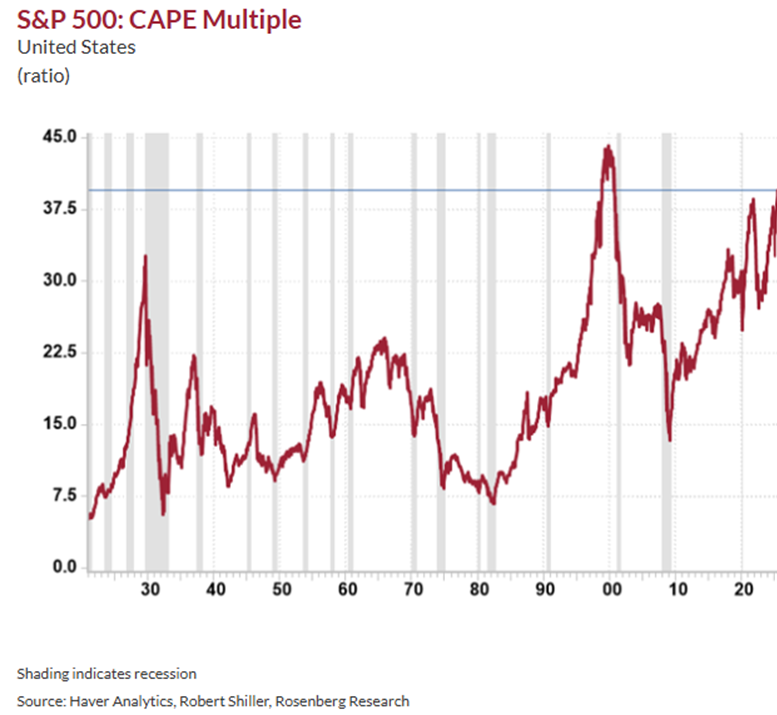
It seems redundant to be talking about stock market valuations anymore since the bullish views continue to be that valuations are less relevant due to expectations of lower interest rates, they aren’t anywhere near the peaks seen in 1999 and that earnings growth will continue to support these levels. Regardless, we still need to periodically check on where we stand relative to historical levels. On that count, the chart below shows the CAPE multiple (Cyclically Adjusted Price Earnings multiple) has expanded by almost +5 points since May to 39.5x, which exceeds every prior bubble peak in the past century outside of the unprecedented tech mania in the late 1990s and early 2000s. This level also compares unfavourably to the 1929 bubble peak of 33x, the ‘Nifty Fifty’ peak in the late 1960s of 24x, and the 1987 pre-crash peak of 18x. The average bubble peak in these prior periods was 26x. It is now pressing against 40x. No matter how you look at it, we are in the stratosphere in terms of stock market valuations! The surge in valuations has coincided with investor sentiment indices soaring off the charts, which happens to be a contrarian negative. When you are priced for perfection and are expecting perfection, disappointment always follows because the world is not perfect. The major point here is how extreme things have become.
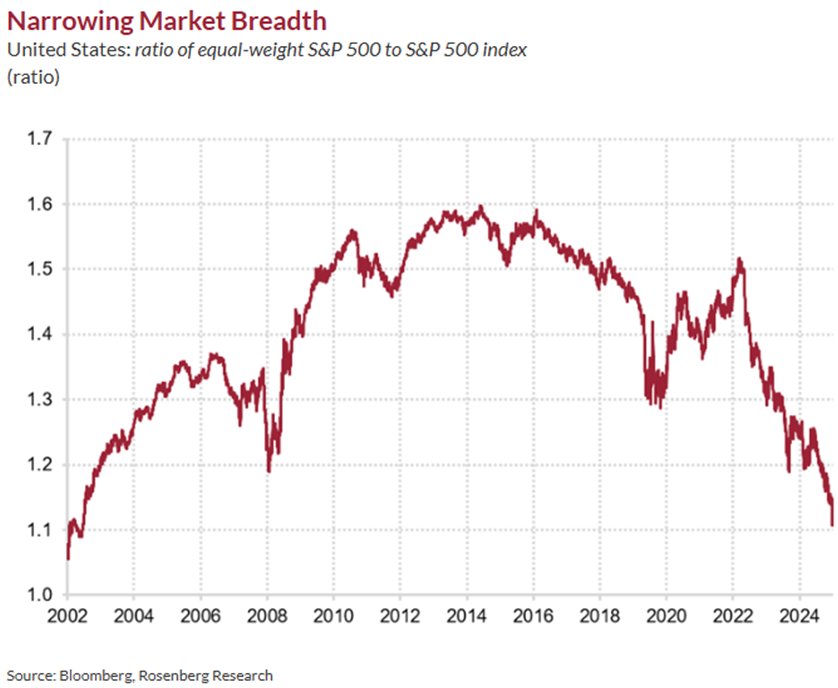
Another ongoing concern has been the narrowness of the advance. Lack of breadth has always been a sign of a bull market in its late stages. The outperformance of large cap tech stocks, particularly over the past ten years, has meant an ongoing decline in breadth that is becoming almost ‘secular’ and therefore less of a good quality investment indicatory than it has in the past. However, when we look back over 50 years in this trend, we clearly see declining breadth as a leading indicator in every bear market. The trend shown below that started in 2006 was certainly a good harbinger of the risks that finished with the Financial Crisis. However, with today’s less patient investor population, broader distribution of information and social media influences, these types of indicators may be losing their predictive capabilities.
While most of the comments here are pointing to the risks in the stock market and provide rationale for our defensive positioning, we also can’t lose sight of the fact that the long-term trend in the stock market is up and that trying to be too clever in anticipating those riskier periods can just cause missed opportunities. For reasons such as that we maintain exposure to what we feel are good quality growth stocks at reasonable valuations.
1 2
Our investment management team is made up of engaged thought leaders. Get their latest commentary and stay informed of their frequent media interviews, all delivered to your inbox.