Keep connected
Our investment management team is made up of engaged thought leaders. Get their latest commentary and stay informed of their frequent media interviews, all delivered to your inbox.
John Zechner
May 5, 2017
The Canadian stock market was hurt by the fact that the two largest sectors, Financials and Energy, each dropped by 1.8% in April. Those losses diluted the strong performance from the Telecom and Consumer sectors, each of which gained over 5% in April. Another interesting note in the Canadian market in April was the fact that the largest stocks were the biggest winners. The large-cap TSX60 Index was up 0.4% while the rest of the TSX Composite was down 0.1% and the TSX Small Cap Index fell 2.4%. The small cap index has a larger weighting in the resource sector, which explains much of its under-performance. But the ‘breadth’ (number of stocks participating) of this advance has clearly deteriorated in the past few months, which is not a good signal for the overall stock market. Market volatility indices have also dropped to 10-year lows. While not necessarily a good market timing tool, the low volatility indicates a complete absence of fear about market risk by investors. Market bottoms have always coincided with extreme spikes in volatility, so this complete absence of volatility is a risk in and of itself for the markets, in our view.
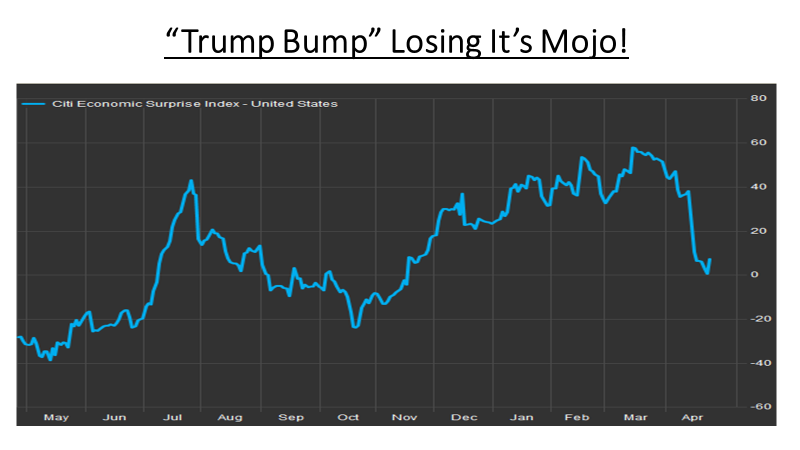
To many pessimists on the economic outlook, the drop in yield on the 10-year government bond from 2.6% is a sure sign that the economy is weakening. After all, this expansion is almost eight years old and it is reasonable to expect a slowdown or even a recession. The disappointing U.S. employment report for March, showing only 98,000 jobs were created, may have been the first sign of trouble. Many ‘soft’ economic indicators such as business confidence and consumer sentiment turned sharply higher after the election of Donald Trump last November, on the belief that his campaign promises of deregulation, infrastructure spending, tax relief, etc. would all lead to a sharp increase in the ‘hard’ economic data such as retail sales, industrial production and business investment. However, the reality is coming up well short of expectations, as shown below in the chart of the Citi Economic Surprise Index in the U.S. After rising from late October to mid-March, the index has turned sharply lower over the past six weeks. Clearly not a good sign for those looking for a pick-up in growth!
We also have to ask ourselves why interest rates, copper and oil prices all declined if the economy is really growing? The weakness in commodity prices could be supply-driven or indicative of slower growth in China for the balance of the year. In terms of the continued low interest rates, the ‘flood of liquidity’ around the world may be playing a bigger role. Central banks in the U.S., Europe, the United Kingdom and Japan have increased their balance sheets by $10 trillion since 2008. Most of those funds have found their way into financial assets, particularly stocks, thus inflating price-earnings ratios and stock valuations but also keeping interest rates low. This was far from the objective of those policies, which was to increase real investment in those countries. As central banks begin to remove those policies, starting with the U.S. Federal Reserve this year, we would expect those financial assets gains to reverse.
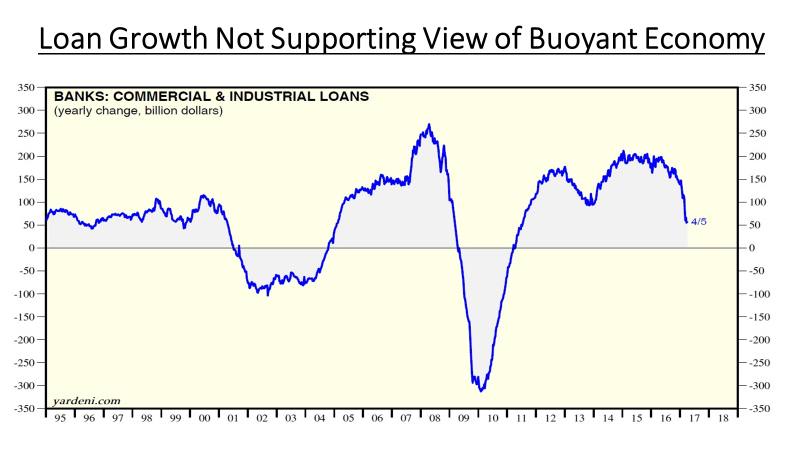
Another ‘chink in the armour’ for bulls on the economy is the pace of commercial and industrial loan growth, which has slowed to its weakest pace in nearly six years, according to Federal Reserve data, adding to worries about economic growth and whether the rally in stocks since the election is justified. There’s a lot of nervousness about the divergence between the strength of soft data following the election and hard data, and one of the weakest examples of that is loans, as shown in the chart below. Commercial and Industrial Loans soared following the Financial Crisis and stayed relatively strong from 2013-2016. But loan growth has slowed significantly in the past quarter. Loan growth has been an excellent lead indicator of economic growth in past cycles and the recent downturn should not be taken lightly.
Our investment management team is made up of engaged thought leaders. Get their latest commentary and stay informed of their frequent media interviews, all delivered to your inbox.