Keep connected
Our investment management team is made up of engaged thought leaders. Get their latest commentary and stay informed of their frequent media interviews, all delivered to your inbox.
John Zechner
May 30, 2025
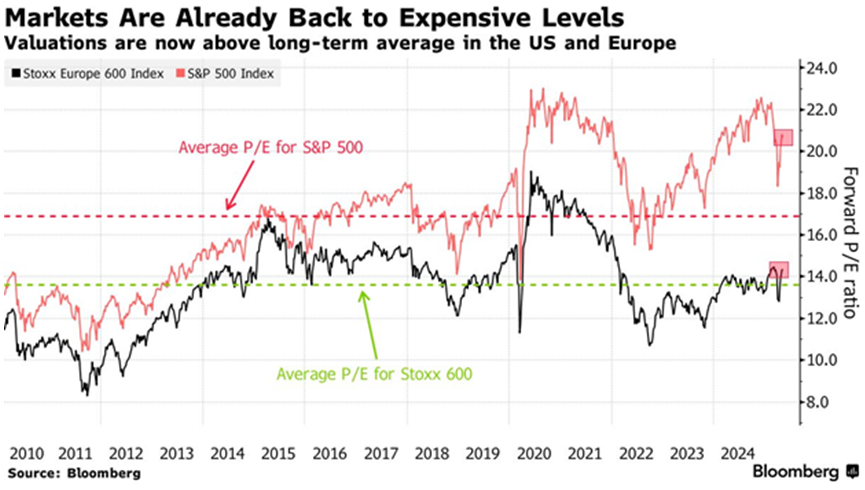
Retail investors have been the leaders of the resurgence in stocks. When trade tensions flared in early April and about $6.6 trillion in market value vanished from U.S. stocks in just two business days – the fifth-worst two-day drop since the S&P500’s creation in 1957 – they didn’t panic. Instead, they did what they’ve learned to do over the past 15 years: They bought the dip. Seven weeks later, the U.S. stocks benchmark had not only recovered but surpassed their pre-tariff levels, delivering a gain of over 20% from the lows for those who stuck it out. On top of buying from retail investors, systematic strategies such as programmed or quantitative funds added fuel to the rally. This cohort of investors uses quantitative models to buy stocks irrespective of valuations or headline risks. Those flows have pushed the market higher into areas where risk/reward becomes thin for everyone using classic valuations or a lack of conviction due to economic uncertainty. That can be seen in valuations, as the recent recovery rally in equities has made them pricey once again, leaving little room for error. Within a few weeks, investors went from slashing exposure to risky assets to chasing the sudden sharp rebound. Buoyed by resilient earnings and expectation that trade deals could be around the corner, stocks are back to being expensive, especially in the U.S. Bank of America’s private client data show the longest weekly buying streak on record, in a sign that retail investors remain unfazed through all this volatility. But with valuations at 21x forward earnings estimates, it’s hard to envision just how much further upside there really is at these levels — especially as signs of distress in corporate America paint a less rosy picture of economic reality than what the White House is promoting. Stocks are trading as though we are back to 2020-2021 interest rate levels when the 10-year T-note yield was below 1.0% and the Fed funds rate was pinned to the zero lower bound as opposed to the reality that 30-year bonds yield recently rose above 5% briefly and the U.S. Federal Reserve seems content to hold interest rates firm at 4.25%. European stocks, on the other hand, are trading right in line with their longer-term average level. Ditto in Canada, where valuations are very close to historical average levels. However, Canada is at higher economic risk from the tariff regime due to the extremely high level of trade between the two economies and the dependence of the Canadian economy on that external factor.
While it has been a successful investment strategy during the ‘zero interest rate’ bull market of the past 16 years, investors should be aware that the ‘buy the dip’ strategy has not always worked out so well. The dot-com crash of 2000 shows how brutal markets can be when the pattern fails. As the selloff began in 2000, retail investors initially showed familiar resilience. Online brokerage firm, ETrade, added almost a million accounts through the end of 2001 as investors tried to catch what they thought were market bottoms. But the approach failed catastrophically. “We’ve come through a highly speculative technology bubble,” Charles Schwab himself admitted in March 2001. “Maybe I should have been more emphatic about understanding that this was a temporary phenomenon.” The Nasdaq would take 15 years to reclaim its previous highs, and the experience scarred retail investors for a generation. The Fed’s Survey of Consumer Finances shows the share of households directly owning stocks dropped from 21.3% in 2001 to 13.8% in 2013. With that measure now back to record levels again, the downside risks should not be ignored.
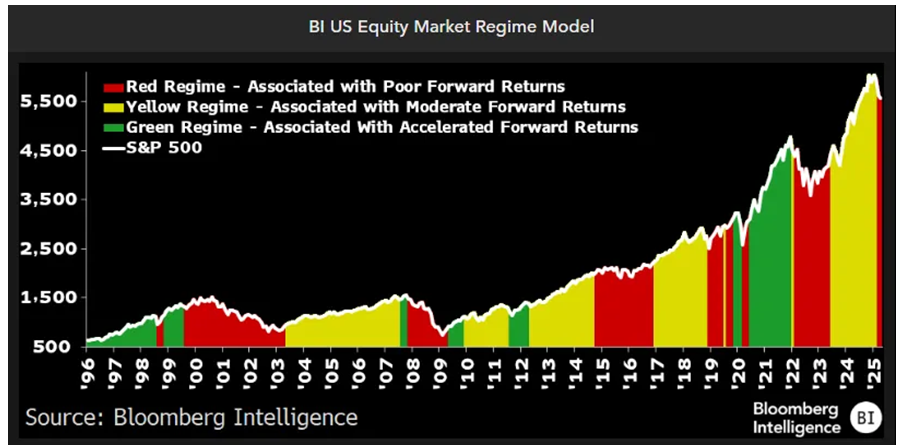
While stock market investors suddenly seem to see a clear road ahead, we see other models that are far less bullish. For what it’s worth, one well-followed model of future stock market returns has entered the ‘red zone’ after trade fears gripped financial markets and dimmed Corporate America’s outlook for profit growth. The Equity Market Regime Model, a Bloomberg Intelligence model that tracks the benchmark stock gauge and clusters periods into three phases — accelerated growth (green), moderate growth (yellow) and decline (red) — fell into the cautious red zone in March and April. Red regimes usually coincide with stretches of negative annualized returns and typically last about 16 months, according to data compiled by BI for trading going back to 1996. A red regime records a 5.6% average annualized loss in the S&P 500, compared to a 29% average gain in a green period. The most recent one started in June 2020, as U.S. stocks rebounded following a pandemic-induced selloff. Certainly not an infallible model, but one that is worth paying attention to since it suggests very little upside, if any, for stocks over the next year.
So where are the safest places to invest that still have upside? A look back at the prior ‘bubble’ in tech stocks gives us some hints. While the bulls correctly point out that valuations in the tech sector, while extended, are much better supported by strong underlying cash flows, resilient business models, global platforms and excessively well-funded balance sheets. We therefore continue to hold onto the technology stocks in our portfolio, particularly those levered to enhance use of AI and the growth of data centers. But we also continue to like long-term government bonds as a great hedge against expected economic weakness, especially in Canada.
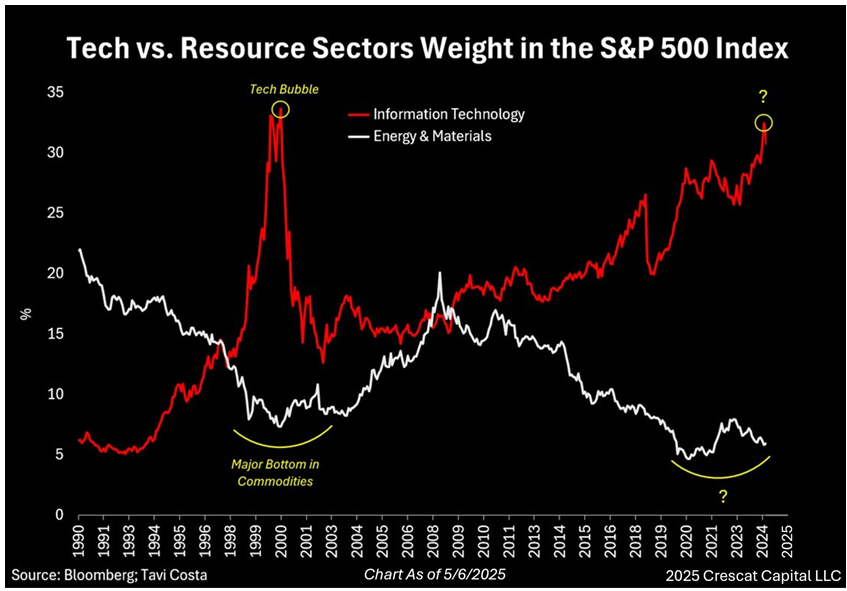
The tougher question is what happens in the resource sector, which has had a relatively good recovery in the past year, but that has been driven mostly by strength in the gold sector. Energy and base metals have had a more difficult time due to worries about global economic growth. ‘Mean reversion’ is not a great short-term trading strategy, but it does tend to see better longer-term dynamics. That is why the chart below is worth paying attention to since it shows how volatile the weight of the technology versus natural resource sectors in the S&P500 has been over time. Those relative weights have now returned back to where they were at the end of the ‘Y2k tech bubble,’ which preceded a decade of strong outperformance by the resouce sectors. However, the key reason for that relative strength was due to the massive in China as it moved into a period of accelerated industrialization. That is clearly not happening now as growth in China has moderated signifcantly. However, with the masssive new growth in articial intelligence, it should be pointed out that the new economy is increasingly reliant on the foundations of the old one and don’t underestimate the extent to which AI and emerging technologies will drive demand for large-scale resource development and infrastructure. Whether that is enough to lead to another round of better relative strength for the ‘hard asset categories’ (and therefore the Canadian stock market), the cheaper relative valuations certainly seem to make the investment worth the risk. Energy infrastructure could be a very strong area of growth over the next decade, with electric grid buildout, nuclear facility rebuilds, natural gas fired generation and pipeline expansion all on the agenda. Copper demand should also increase at a time when new supplies are limited.
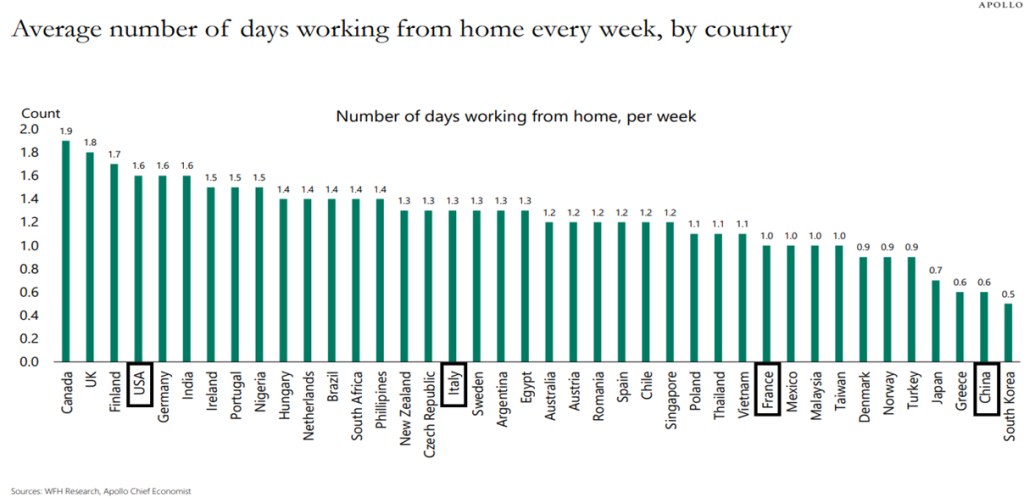
Finally, yes, we are Number One at something in Canada…….that is, working from home! It probably has more to do with the broad geography of the country, the concentration of jobs in service industries such as financial services and, of course, the greater impact of weather for most of the year. Anyways, as I write this column from my home in Collingwood 2 hours north of Toronto, I am clearly tipping the balances to the higher number of those days as I get to the office one day a month at the most. But if the pandemic taught us one thing it’s that we can do almost anything in a service industry remotely and it does increase the efficiency of your day. Not as great for people from a social contact and collaborations point of view, particularly for those earlier in their careers, but my three dogs have definitely been the beneficiaries of this new phenomenon.
1 2
Our investment management team is made up of engaged thought leaders. Get their latest commentary and stay informed of their frequent media interviews, all delivered to your inbox.