Keep connected
Our investment management team is made up of engaged thought leaders. Get their latest commentary and stay informed of their frequent media interviews, all delivered to your inbox.
Jacqueline Ricci
October 27, 2022
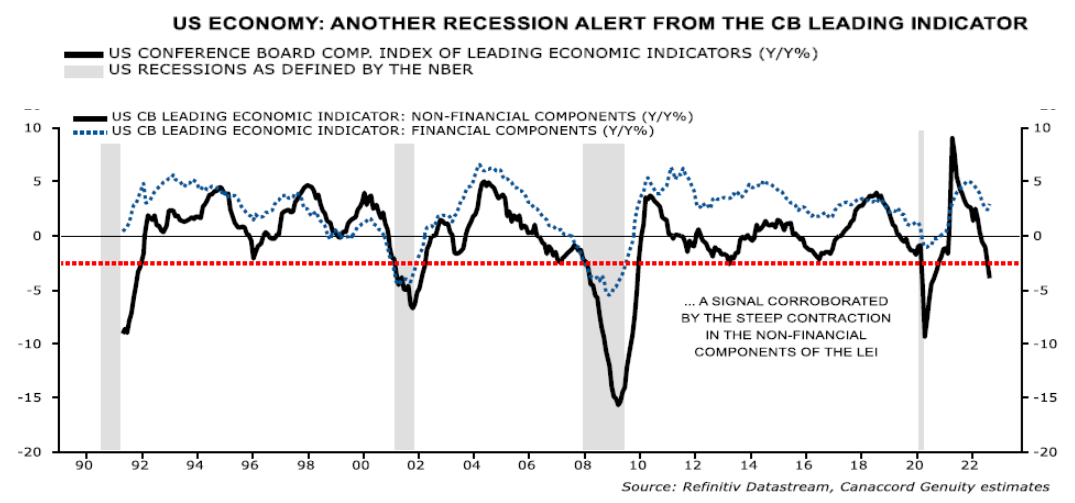
Most investors agree the market has been undergoing a significant correction over the last three quarters. The question is when will the correction run its course? The chart below indicates that the economy is entering a slowdown/recession. Although lagging indicators are still positive, leading indicators have rolled over significantly.
Although history does not repeat itself identically, history can be used as a guide to the future. When we look at past bear markets; typical corrections can be segmented into three scenarios. Corrections that are roughly 20% lower from the highs, corrections that are between 20% to 40% and declines measuring approximately 50%. The following chart shows the performance of previous bear markets after they have experienced a -20% correction. The blue line is the current period. As can be seen below, the US market has already fallen to levels where most bear markets end. Only the 1973-74, 2000-2002 and 2007-2009 bear markets last longer and fell materially lower from current levels.
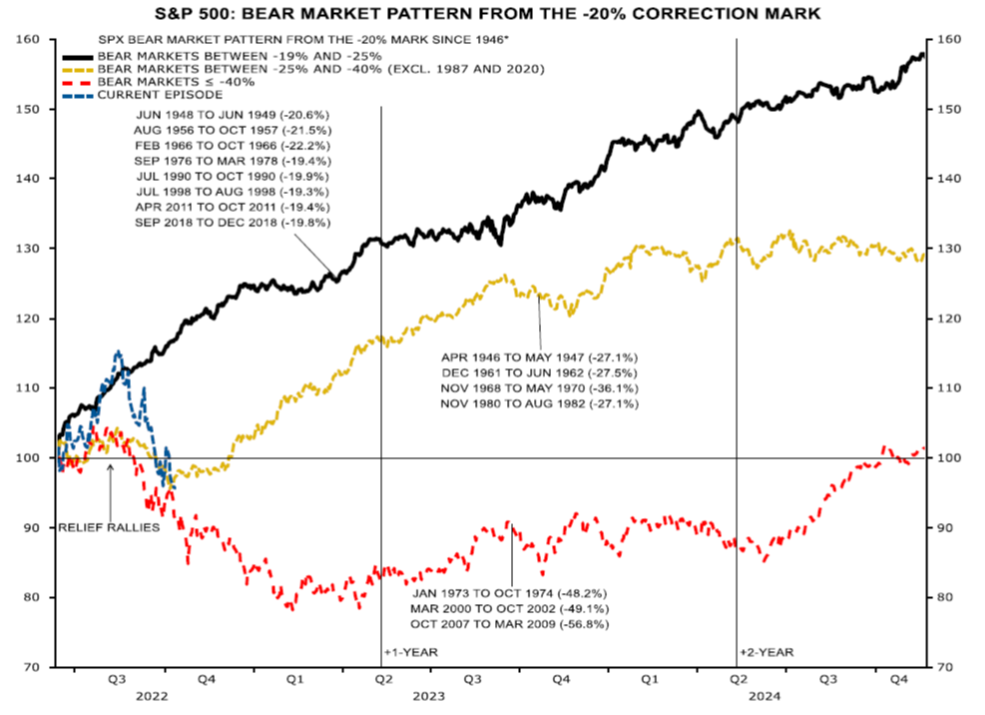
Given the robust consumer spending and labour market, we believe we are in the middle bear scenario (yellow line), and the market bottoms around current levels. Interestingly, in all the middle bear scenarios, equity markets bottomed in the fourth quarter and higher six months later.
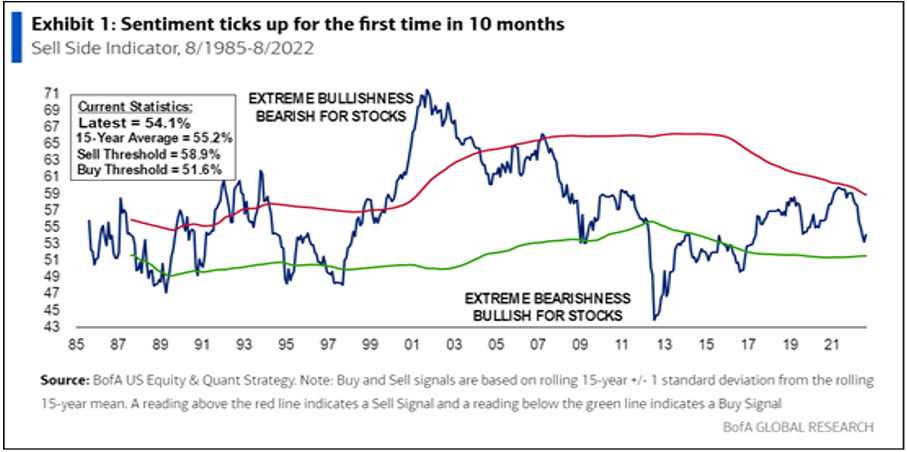
Supporting this thesis is the Ned Davis Crowd Sentiment Poll. This poll has been in the extreme pessimism zone since April 2022, or 112 consecutive trading days, which marks the third longest streak of gloom since the data began in 1995. Investor sentiment in unquestionably the worst it has been since the crisis of 2008, with losses in government bonds contributing to investors negativity. Bank of America’s proprietary sell-side sentiment indicator has been a reliable contrarian signal in the past and indicates a rally may be forthcoming.
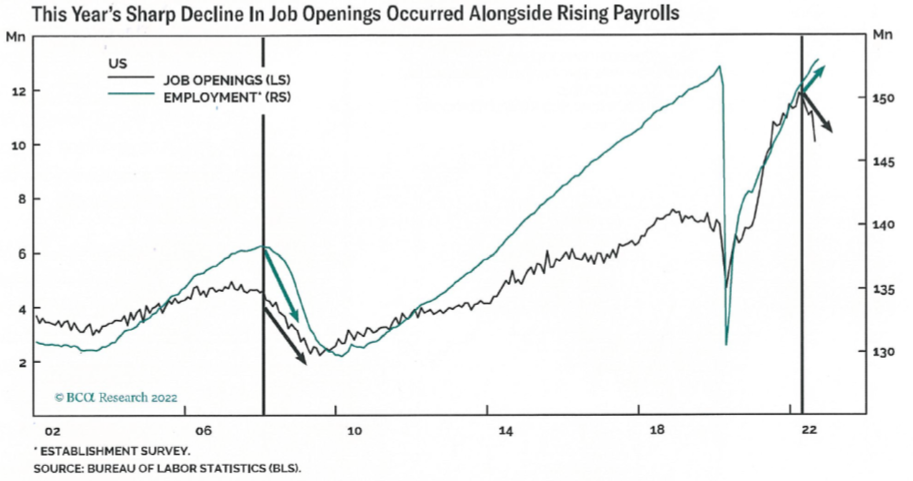
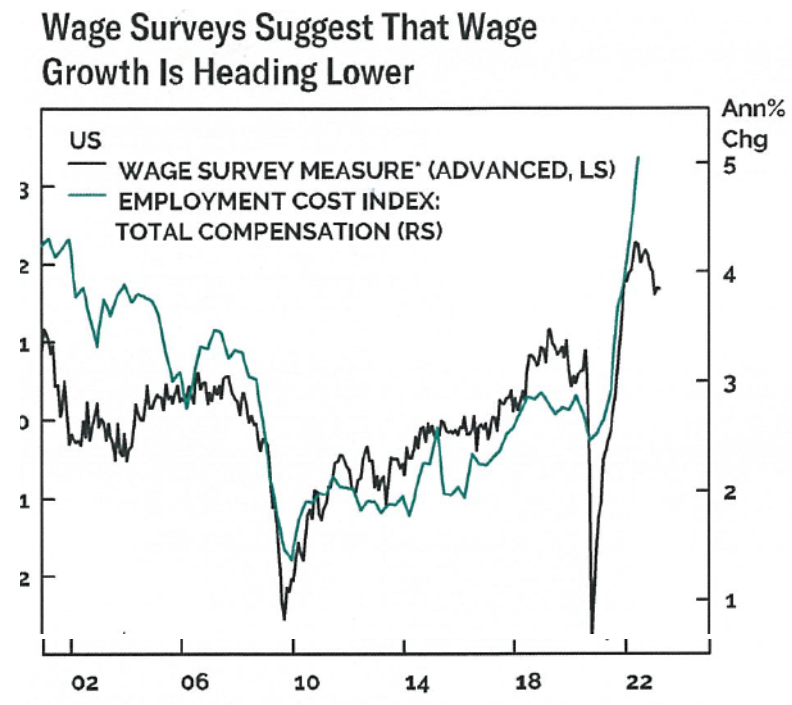
Many investors are waiting for the Fed to pivot from their hawkish stance and outsized interest rate hikes. Conventional wisdom used by central banks is that “front loading” interest rates is necessary to lower aggregate demand and bring down inflation. But according to the Bank Credit Analyst, wage growth is the long-term driver of inflation and wages tend to track the job openings rate (which have been in decline for many months). This leads us to believe that the Fed is almost finished raising rates and that they will pause in 2023 as previous rate hikes take their toll. The following chart shows the sharp decline in job openings along side rising payrolls.
The associated chart below also suggests that wage growth is heading lower in the US.
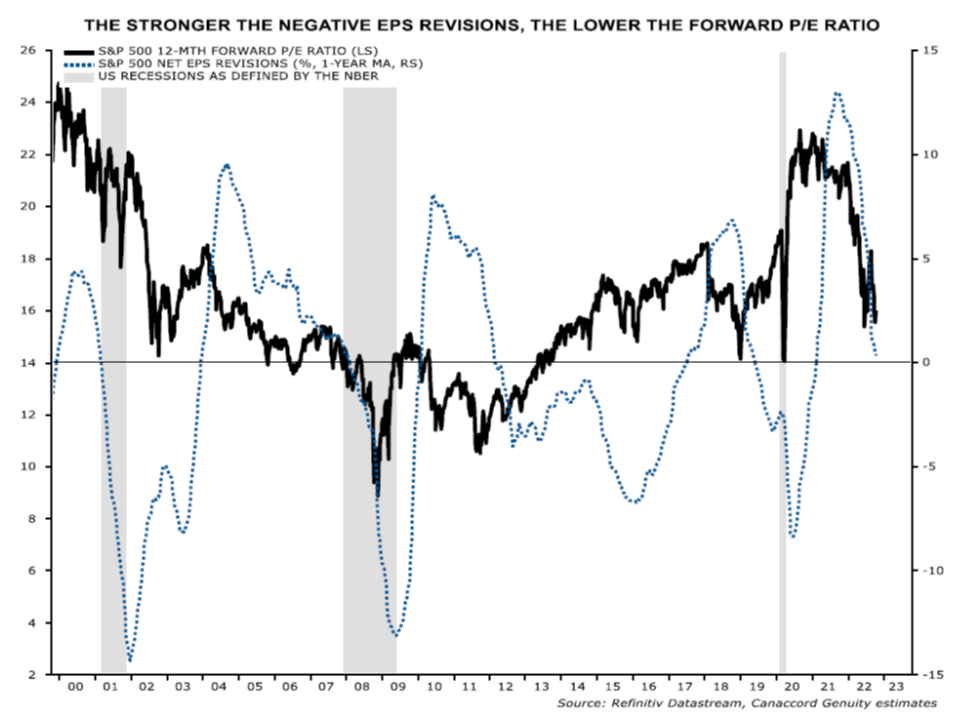
Obviously, the expectation is for further rate increases over the next two months, however these interest rate increases are already priced into the market. The more significant risk to the markets is that earnings expectations are too high. The following chart shows forward earnings estimates have already come down in combination with forward price/earnings ratios.
Getting through this rough patch is critical to looking forward as to what will lead the market going forward. Although most sectors are down significantly this year, the energy sector has been a bright spot, and is up over +15% to September 30th. We continue to believe the energy sector will continue to outperform the general market due to low stock valuations, robust earnings, strong capital discipline and tight global energy markets.
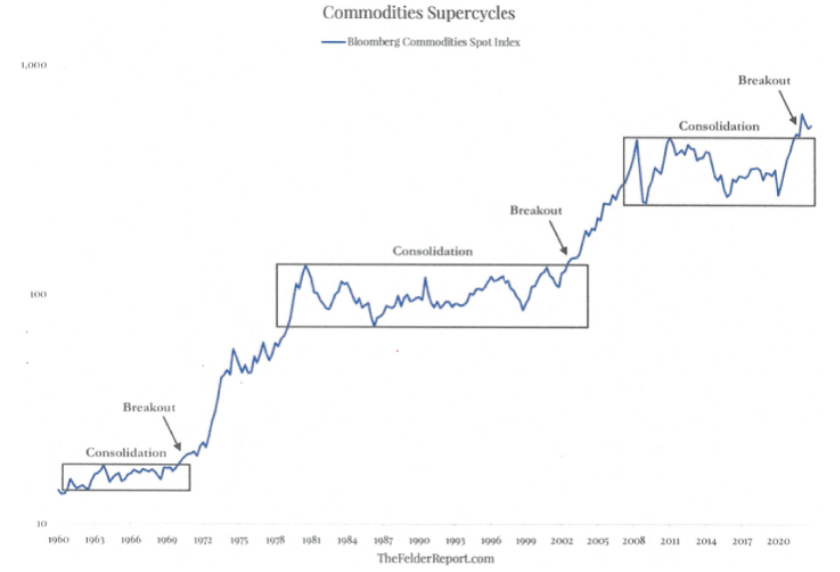
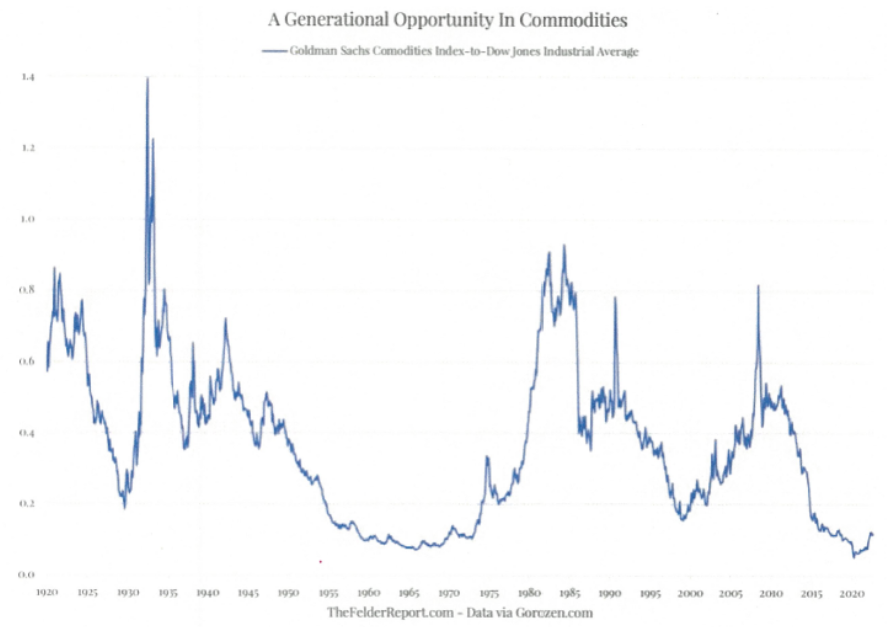
For the last decade, the technology sector has led the markets and we anticipate that investors will go with what has worked in the past by aggressively adding to technology stocks when risk sentiment turns. With short positions in technology stocks at historic levels, covering shorts could provide the first significant move in a rally. In anticipation of this, we have started increasing the portfolio’s technology exposure. However, we still favour energy and material stocks as the commodity sectors have only just begun to break out of a multi-year consolidation period.
1 2
Our investment management team is made up of engaged thought leaders. Get their latest commentary and stay informed of their frequent media interviews, all delivered to your inbox.