Keep connected
Our investment management team is made up of engaged thought leaders. Get their latest commentary and stay informed of their frequent media interviews, all delivered to your inbox.
Jeff Herold
August 3, 2017
two years, which led to concerns that Canada’s export sector would struggle, negatively impacting the country’s economic growth. That, in turn, could lead the Bank of Canada to postpone additional interest rate hikes.
U.S. economic data was generally positive, but not as robust as Canadian indicators. Unemployment remained near cyclical lows, as rising participation offset good job creation. As anticipated, the second quarter GDP growth rate rebounded to +2.6% from the weak +1.2% rate of the first quarter. However, the chaos of the Trump administration and inability of the Republican-dominated Congress to enact significant legislation diminished expectations for a significant fiscal spending boost to economic growth. The Federal Reserve left rates unchanged, as expected, and it hinted that it would begin reducing its massive holdings of bonds in the next few months.
The Canadian yield curve experienced a bear steepening in July as the biggest yield increases occurred in the longest maturities. The yields of 2 and 5-year Canada Bonds rose 20 and 27 basis points, respectively, while 10 and 30-year yields jumped 31 and 34 basis points. By comparison, the changes in U.S. bond yields were much more subdued, with 2-year Treasury yields actually declining 3 basis points and 30-year yields rising only 6 basis points. Since the Bank of Canada’s June warning regarding interest rate increases, Canadian yields have moved much closer to their U.S. counterparts. The yield of 10-year Canada Bonds, for example, had been about 75 basis points lower than 10-year U.S. Treasuries for the first five months of this year, but were only 24 basis points lower at the end of July.
The jump in yields caused bond prices to decline, leaving the federal sector with a -1.56% return in the month. The sector outperformed the overall Universe index because its duration was roughly 1 ½ years shorter. In contrast, the provincial sector plunged 2.67% due to its longer average duration. Demand for provincial issues, particularly from international investors, remained good prompting provincial yield spreads to narrow by 3 basis points in the month. Investment grade corporate bonds returned -1.38%, with BBB-rated issues outperforming higher rated issues at all terms because of their higher yields. There was $7.7 billion of new fixed rate corporate bond issuance in July, of which three large bank deals accounted for $5.25 billion. Non-investment grade issues earned +0.62%, as the good economic environment prompted high yield investors to ignore the narrowing differential with investment grade issues. Real Return Bonds dropped -3.24% in the month, but markedly outperformed nominal bonds of similar durations (the long term federal sector returned -4.87% in July). Preferred shares ignored the bond market turmoil, gaining +1.11% in the period.
In a change of its policy, index provider FTSE Russell announced that legacy non-viability contingent capital (NVCC) bank bonds would be included in the FTSE TMX Canada Universe Bond index commencing February 7, 2018. FTSE Russell had previously stated that NVCC bonds issued after July 1, 2017 would be included in the index, but earlier issues would still be excluded. There are approximately $16 billion of legacy NVCC bonds outstanding. Yield spreads of those bonds had already tightened in anticipation of the announcement, but firmed slightly more following the news. The long lead time before the bonds actually enter the index may have reflected FTSE Russell’s attempt to placate index fund managers, who now must accumulate positions in the bonds. With other index providers trying to supersede it, FTSE Russell likely wanted to minimise the impact on some of its biggest customers. The impact on our portfolios was mildly positive; we have never viewed the index as a prescription of what to invest in, and have using NVCC bonds since their inception three years ago.
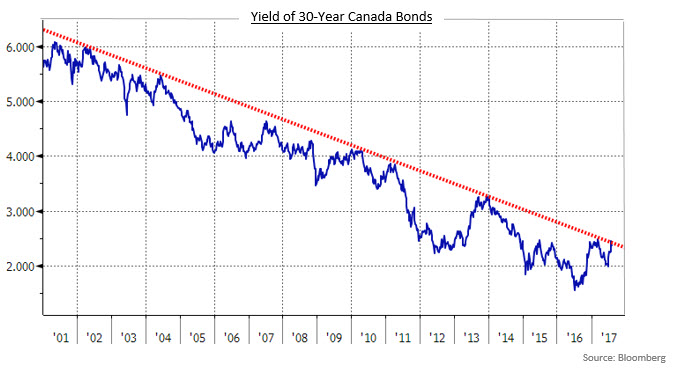
As can be observed in the following chart, the trend to lower bond yields has been going on for several years. The recent uptick in bond yields has only brought them in line with the long term downtrend. While we do not rely on technical analysis in managing portfolios, it can provide some sense of potential psychological trading levels. If enough people pay attention to the potential resistance, it can be a self-fulfilling prophecy. Another interesting aspect of the graph is how much yields declined after the financial crisis. The quantitative easing programmes of various global central banks, particularly the Fed and the European Central Bank, were the major reason for the decline in yields since 2011. As those programmes come to an end and the respective bond holdings begin to be unwound, that should put upward pressure on bond yields. The Fed is expected to begin reducing its holdings in September and the ECB will probably announce reductions to its quantitative easing later this fall.
Another reason that we prefer to remain defensive with regard to duration is that Canadian bonds remain expensive to their U.S. counterparts. The recent outperformance of the Canadian economy means that it is much closer to the full employment status of the U.S. economy, and there is little justification for our long term bonds to remain almost 50 basis points below U.S. Treasury yields.
Our investment management team is made up of engaged thought leaders. Get their latest commentary and stay informed of their frequent media interviews, all delivered to your inbox.