Keep connected
Our investment management team is made up of engaged thought leaders. Get their latest commentary and stay informed of their frequent media interviews, all delivered to your inbox.
John Zechner
September 29, 2019
Stocks continued their late-August rally into September as ‘big money flows’ turned more positive, with index funds seeing continued inflows and major pension and sovereign wealth funds re-balancing their holdings towards stocks, away from bonds. While record low interest rates over the last decade had lead to continued gains in bond prices, they had also inflated the value of longer-term growth stocks as well as the ‘yield sensitive’ sectors such as utilities and real estate. The movements in these asset classes lead to a situation where the relative valuations between so-called ‘growth’ and ‘value’ stocks had become as distorted as they had been at the end of the technology boom/bubble in 2001. Traditional ‘value’ sectors of the market such as industrials, energy and financials tend to be more ‘economically sensitive’ than the ‘growth’ sectors of the markets, whose valuations are heavily impacted by the level of interest rates. The low interest rate, low growth environment of the past decade had fueled this record disparity between the two stock groups as investors discounted the future earnings of high growth companies such as Amazon, Netflix, Beyond Meat, Shopify and the Cannabis stocks at much higher rates. At the same time, the low growth environment lead to much lower valuations for traditional companies in the basic materials, financial services, retailing and industrial sectors.
Then in the second week of September we witnessed a reversal in this trade as U.S. 10-year yields shot up from 1.45% to 1.90% on some economic optimism about U.S. economic data looking slightly better (most noticeable was the Citi Economic Surprise Index reversing to upside), hopes for a trade breakthrough with China and some firmer core inflation numbers. Energy, base metal, industrial and financial stocks all moved up sharply while the interest sensitive utilities, consumer staple and high growth (i.e. FANG) stocks all gave up some gains. Investors wondered if this was this finally the long-awaited and well overdue switch from growth to value? But if you blinked you missed the move as weaker data from China, recession-like readings from Europe, some high profile earnings warnings (Fedex) and more dovish central bank chatter seemed to put this reversal to bed very quickly. At month end it was still undetermined if this was finally ‘the big switch’ or just another false start for the cyclical groups.
But September has still shown some changes in leadership. Financials and Energy had their best months of the year and bonds are still showing negative monthly returns even though the 10-year bond yield in the U.S. slipped back below 1.7% and yield-sensitive stocks have begun to recover. The reason for such abrupt changes is straightforward: It all comes down to constantly changing expectations of growth, inflation and liquidity. Any meaningful compression of growth and inflationary expectations leads to underperformance of value and cyclicality. On the other hand, perception of ‘goldilocks’ (i.e. moderate growth momentum, greater liquidity and subdued inflationary pressures) unleashes value rallies. In the end, it seems that the TINA trade (“There Is No Alternative”…..to stocks) is still very much alive until we start to see some upward move in interest rates. That could come from stronger than expected growth (not likely) or some upward pressure on core inflation (more likely given we have seen core inflation move above target range of 2%).
But our overall view continues to be that the ‘cyclical stock recovery’ that we have seen is not sustainable, even if it was overdue. The primary reason is that we expect the economic data will continue to weaken. While there remains a debate as to whether this will end in a full-blown recession or only a ‘mid-cycle slowdown’ like in 2015-16 and 2011-12, there can be little debate as to whether the data has been deteriorating, as shown in the charts below.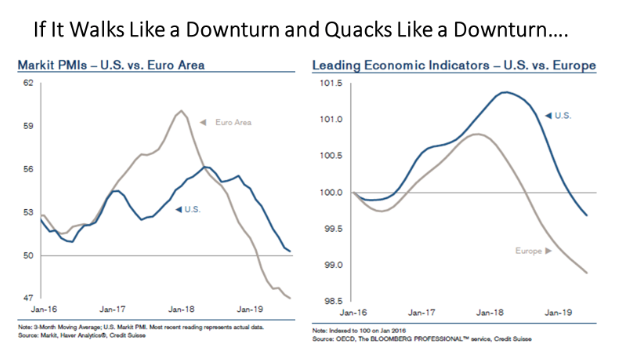
The latest batch of economic releases is starting to reverse some tentative signs of stabilization that were emerging just several weeks ago. Poor industrial production and trade numbers from around the world (China, Eurozone, Japan, Latin America and the U.S.) are now complemented by weakening service sector trends and downtrends in investor/consumer confidence. At the same time, China credit impulse, which was improving in the second quarter, started to roll over again. China’s slowdown is deepening just as risks for the global economy mount, piling pressure on the authorities there once again to do more to support growth. Industrial output rose 4.4% from a year earlier in August, the lowest for a single month since 2002, while retail sales came in below expectations. Fixed-asset investment slowed to 5.5% in the first eight months, with the private sector once again not meeting expectations but being offset by state-sponsored (government) investments. The data add support to the argument that policy makers’ efforts to reverse the slowing economic trends aren’t sufficient as the nation grapples with structural downward pressure at home, the risk of yet-higher tariffs on exports to the U.S. as well as rising oil prices.
Many headlines in the past two months have also pointed out the ‘inversion of the yield curve’, where 10-year government bond yields dropped below the level of 2-year yields. While many pundits argue against the accuracy of this indicator, saying that it has signaled ‘eight of the last five’ recessions, the chart below shows that it has been a pretty reliable indicator over the past 40+ years as the curve has inverted (gone negative) just before the prior five recessions (shaded area of chart)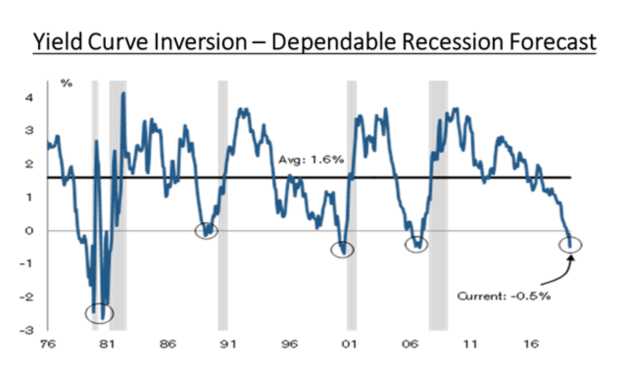
This relationship seems logical. Economic cycles typically end when growth causes inflationary pressures to rise, which results in central banks raising short term interest rates to control those rising pressures. Coincidentally, long-term interest rates begin to fall as they start to reflect slower growth expectations and the result is an inverted yield curve. Putting the above chart into a different historical context, Haver Analytics has taken the information from prior cycle yield curve inversions using a variety of measures to effectively come up with a ‘composite index’ that forecasts the probability of a recession occurring in the next twelve months. That chart is shown below. From it we can clearly see that the ‘recession risk’ has risen sharply in the past eighteen months, to over 40%. That level is eclipsed only by the levels seen in late 2000 and again in 2007. Investors don’t have to be reminded about what happened to both the economy and stocks following those two periods.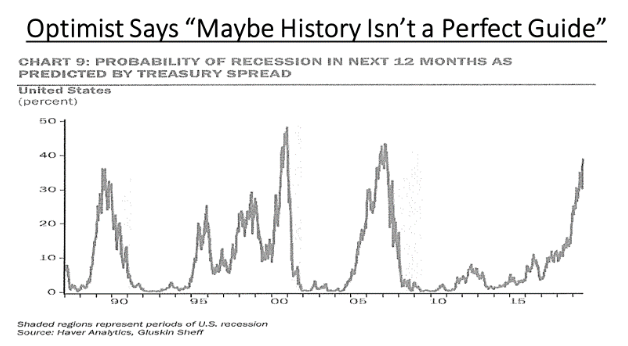
Another risk worth mentioning for financial markets is that high levels of corporate debt are suddenly a whole lot more worrisome than they were just a couple of months ago. U.S. financial account figures recently released by the Federal Reserve showed the amount of money U.S. companies have borrowed continues to swell. Domestic nonfinancial companies had $9.95 trillion in debt outstanding in the second quarter, an increase of $1.2 trillion from just two years ago. At 47% of gross domestic product, the level of corporate debt in relation to the economy has never been so high. High corporate-debt levels represent a vulnerability. If demand shows signs of faltering, companies could be quicker to ratchet down spending and hiring than they would be if they weren’t so indebted, putting the economy at risk. Like tech in 2001 and housing in 2007, we expect corporate debt to be this cycle’s landmine. Not only is coporate debt at a record, the proportion of this debt in grades lower than ‘Investment Grade’ is also back near record levels. This is another reason to be cautious on bank stocks as they are at epi-centre of this issue. They are also facing slow loan growth, increasing loan-loss provisions and difficult funding conditions due to low interest rates. We remain at zero weight in Canadian bank stocks while, in our Hedge Fund, we have short positions in major U.S. financial stocks and some Canadian lifecos.
All of the above notwithstanding, there remains constant debate as to whether the global economy is just in another mid-cycle slowdown, similar to those that occurred in 2011/12 and 2015/16, or whether we are headed to the first global recession since the Financial Crisis of 2008. The answer to that question is critical for stock markets. As shown in the table below, stocks do tend to experience very sharp declines once a recession occurs, even if interest rates are at low levels and/or falling. Mid-cycle slowdowns have been kinder to stock investors as they don’t always end in bear markets. Our own view continues to be that we are nearing the end of this cycle. Europe is already in recession, in our view, while Chinese growth had fallen to its lowest level in over two decades. Can North America be far behind?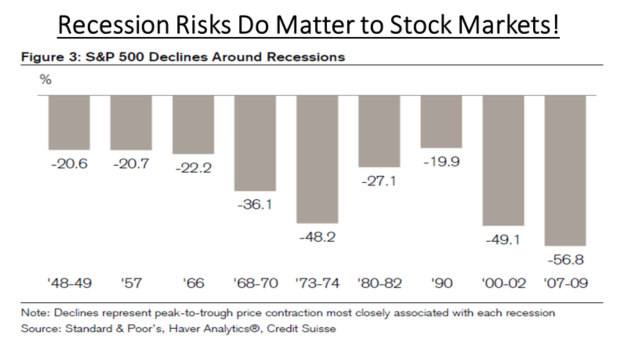
Money managers that mimic the stock market have become the new titans of the fund-management world. Funds that track broad U.S. equity indexes hit $4.27 trillion in assets as of Aug. 31, according to research firm Morningstar Inc., giving them more money than stock-picking rivals for the first-ever monthly reporting period! Funds that try to beat the market had $4.25 trillion as of that date. The passing of the asset crown is the latest chapter in one of the most dramatic transformations in the history of financial markets. In the past decade, $1.32 trillion fled actively managed U.S. equity mutual funds and exchange-traded funds as nearly $1.36 trillion was added to low-cost funds that mimic market indexes. 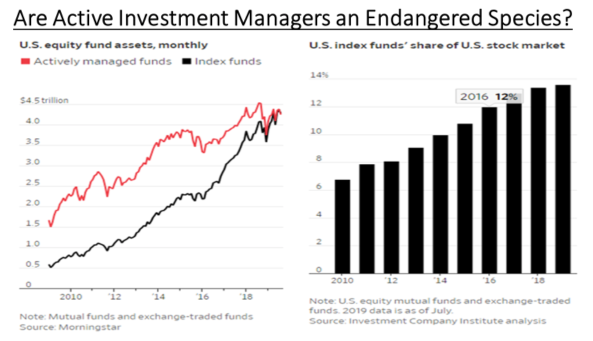
Indexing giants such as BlackRock Inc., Vanguard Group and State Street Corp. now wield considerable power over corporate America and can cast pivotal votes that determine everything from who sits on a company board to how executives deal with issues ranging from climate change to pay equity. The rise of indexing has attracted scrutiny from those who are worried market-mimicking funds could distort prices and exacerbate market turbulence. Index giants have so far dismissed those concerns as fear mongering as they continue to grow, but the simple reality is that we have yet to see how these passive funds will act in a full-blown bear market, which we have not seen since 2008 when passive funds were just not a significant player in the markets.
Given this shift from actively managed funds into passive funds, we have seen that quantitative money flows have become the most important short-term driver of stocks. Due to their sheer size, watching these flows is critical for shorter-term trading trends. Some evidence of the importance of these flows were shown when money flows turned negative in January 2018 and again in September 2018 (both prior to significant stock pullbacks) then turned positive in late December 2018, June 2019 and again in late August. Those periods all coincided with strength in markets and also telltale late-day rallies most days. While this is clearly not a metric for longer-term ‘buy and hold’ investors, it is certainly worth paying attention to for those more focused on potential shorter-term moves. In our Hedge Fund, we moved from largely net short to slightly net long in late August, driven by those indicators, and were adding to ‘value stock sector’ positions in our managed accounts. While picking the right stocks and market sectors over any period will always be the more important determinant of longer-term investment returns, it will be interesting to see if these money flows remain strong even in the face of weakening economic growth and expected earnings shortfalls over the next few quarter.
Our investment management team is made up of engaged thought leaders. Get their latest commentary and stay informed of their frequent media interviews, all delivered to your inbox.