Keep connected
Our investment management team is made up of engaged thought leaders. Get their latest commentary and stay informed of their frequent media interviews, all delivered to your inbox.
John Zechner
November 4, 2025
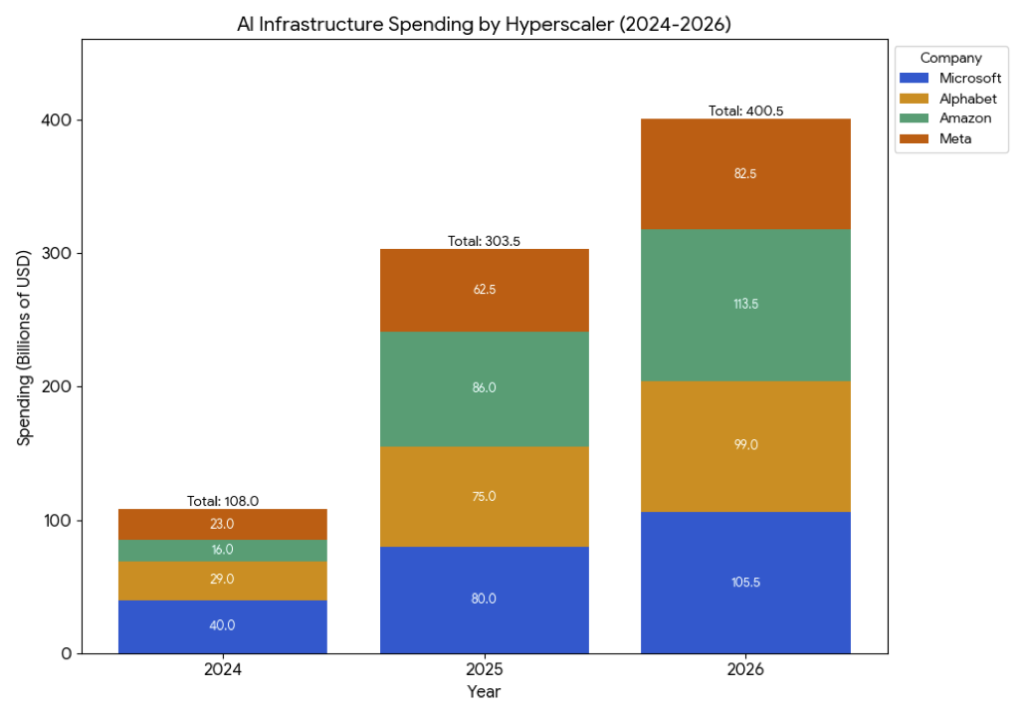
Technology spending continues to make the best case for the bullish narrative on stocks. In terms of the reports from the ‘Magnificent Seven’, the ‘A’s’ drew Accolades and Applause from investors while the ‘M’s’ saw Misery and Myopia. They all continued to deliver stellar results, but the reactions were more muted on the upside since expectations were already so high. ‘Misses’ relative to expectations or other anomalies in the results were not taken well, with the 15% two-day drop in Meta shares being a prime example. Investors are clearly more wary of companies that keep increasing their spending without visible results, more so when that spending is funded by debt, which Meta did with a $30 billion bond offering to help fund their increased investment in AI infrastructure. The other ‘M’, Microsoft, did beat the expectations but investors had set the bar incredibly high so the 40% annual growth rate in their cloud business, Azure, fell short of the ‘whisper number’. Amazon and Alphabet, on the other hand, each jumped more than 10% after both companies posted third-quarter earnings that exceeded expectations, with strong 20%+ growth in their respective cloud-computing units, following a few quarters of declining growth. Cloud growth had been a key area of concern for both as they faced intensifying pressure from Microsoft as well as the newer entrant to the AI cloud, Oracle Corp. While Amazon remains the leading provider of cloud infrastructure technology, it’s been battling the perception that it’s missing out on a flurry of highly lucrative AI deals for cloud services. That concern has weighed on Amazon’s stock, which had been up only 1.6% year to date, trailing its Magnificent Seven peers, prior to the release of the numbers this week. The other ‘A’ to report was Apple Inc. While results only slightly surpassed expectations, there was a lot of excitement around the release and initial sales of the iPhone17, especially in China. CEO Tim Cook painted a very bright outlook for sales into the traditionally strong Christmas selling season. There will continue to be endless debate about when the payback of all this spending on AI will begin to occur and how big it will be. For now, the only major data points we can rely on is what the major hyperscalers plan to spend on this rollout and that is shown in the chart below (which incidentally, was generated by a simple request on Google Gemini). The estimated level of over US$400 billion in 2026 represents a quadrupling of the level just two years prior and certainly explains the strength in the suppliers to this growth, particularly the semiconductor companies and the data centre equipment vendors, such as Canada’s Celestica Inc.
But the true test for the sustainability of the technology rally will be in the ability to convert this spending into quantifiable productivity gains for the users and/or services that users are willing to pay for. Companies cannot continue to put capital to work without tangible returns. That is essentially what ended the tech bubble in 2000. In that case the buildup had been on transmission fibre to power the growth of the internet. Capacity got hugely overbuilt and the returns for the investors were not there since consumers were unwilling to pay for this capacity at anything close to what was required to generate an economic return. We know the bullish story is that we are still at the very early stages of the AI rollout and that the technology is revolutionary. Unfortunately, the stock market is already paying up for that bullish expectation so any shortfalls will be treated harshly. Investors need to look no further back than January of this year when the revelations that Chinese upstart, Deepseek, built a large language model at a minor fraction of the cost that industry forerunner, OpenAI, had spent lead to an incredibly sharp and fast retreat for the entire sector. The lack of free cash flow might start to matter for big tech investors as well. The strength of large tech stocks over the last few years was justified by their dominance and growth, but another big positive was the fact that they had been massive generators of free cash flow that allowed them to make acquisitions to broaden their coverage, eliminate debt and buy back stock. That period has come to an end with the massive spending required to fund the growth of AI and buildout of data centres. This has not yet been a drag on the stock prices of the tech giants, but history shows that could change as investors are less comfortable with negative free cash flow, especially when they can’t yet see the return on that spending. Tech companies have changed tactics in how to fund these expenditures now that they are running negative free cash flows. We have seen total tech sector debt issuance this year has balloon by over +$200 billion to fund all the capacity expansion, and that is an unprecedented boom in leverage. Also, in this latest chapter of the AI story, we have the “circularity” issue, which looks a lot like the vendor-financing wave in the late 1990s. Meanwhile, investors are behaving as if the Tech boom is going to deliver average annual earnings growth of +15% at least through 2030 and a Total Addressable Market for AI that will swell by 8x to as much as $4 trillion. Much of this sounds a lot like what was being discounted for the World Wide Web heading into the 2000 Tech bubble peak.
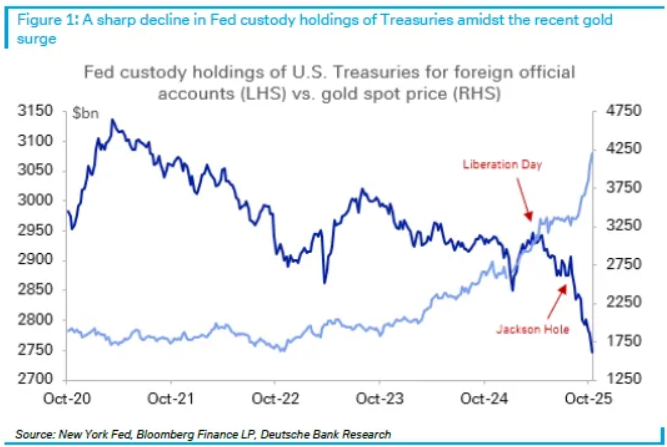
Gold will continue to shine. Gold’s performance this year has been remarkable, surpassing the expectations for even for those of us who had a positive outlook coming into the year. This may not continue at the same rate but is not yet at an end since central banks are long-term buyers and not traders so we expect that they will continue to add to reserves, with the public now also joining in to drive this most recent surge through US$4,000. That new contingent of buyers should be viewed as less committed and driven by momentum trades and this has added to the volatility in the price of gold, including the surge to $4400 and the very fast 10% retreat. The bigger story will remain the fact that central banks want to diversify their holdings away from the U.S. dollar but do not see the Yen of the Euro (or certainly not the Chinese Yuan) as a Reserve Currency. With U.S. fiscal deficits expected to continue to run at recessionary levels of over 6%, the borrowing requirement of the U.S. Treasury will ensure that foreign reserves continue to look at alternatives to the ‘mighty buck!’ After sitting on the sidelines for much of the early period of gold’s rally, retail investors have taken a bigger role in recent months, in part enthused by the debasement theme. Pictures showing queues of buyers lining up outside bullion retailers went viral on social media. Options volume on the top gold-backed ETFs and futures contracts, a popular way for retail investors to take big bets on the metal’s value, have surged. The chart below supports our view that central banks have been diversifying away from U.S. treasury holdings with the price of gold being the prime beneficiary of this shift. This remains a secular bull market and the precious metals had simply deviated far too much from their positive trendlines which, in our view, remain intact.
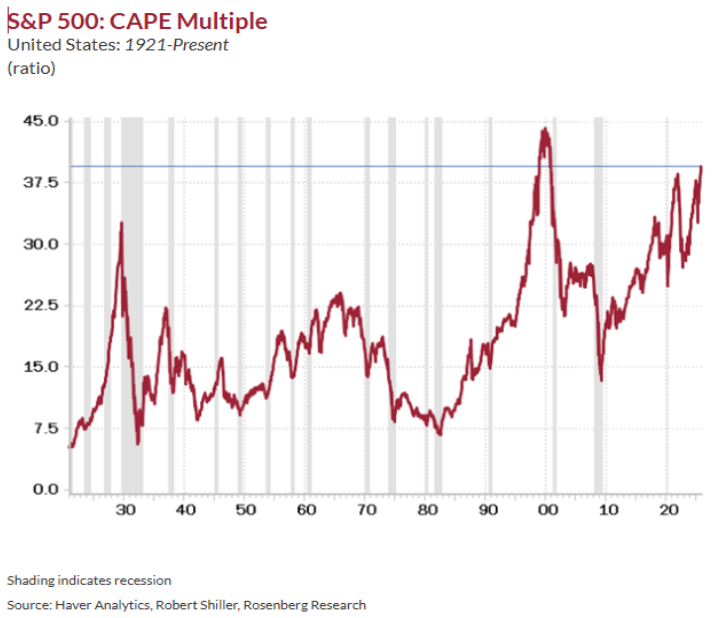
Regarding stock market valuations, we keep hearing that they are becoming “stretched, but not yet at levels consistent with historical bubbles.” We disagree. Valuations by almost all measures we look at are at or near record levels. Start with the most basic long-term reading on earnings, the CAPE (Cyclically Adjust Price Earnings) multiple, also known as the ‘Buffet Indicator.’ The CAPE multiple now exceeds every prior bubble peak in the past century outside of the unprecedented tech mania in the late 1990s and early 2000s. This compares to the 1929 bubble peak of 33x, the Nifty Fifty peak in the late 1960s of 24x, and the 1987 pre-crash peak of 18x. The chart below doesn’t lie. The average bubble peak in this valuation metric is 26x. It is now pressing against 40x. Both the IMF and the Bank of England (BOE) just issued warnings that the AI bubble risks an “abrupt” market correction and the IMF managing director stated that all the bullish sentiment about “the productivity enhancing potential of AI” could “turn abruptly.” The BOE separately concluded that “the risk of a sharp market correction has increased” and valuations are now comparable with the peak of the dotcom bubble.” The only country in the world with a CAPE multiple pressing against a 40x ‘nosebleed’ level is the United States. That seems out of sync, in our view, with a potentially destabilizing government debt load, with the IMF just issuing a report that the lack of fiscal discipline will mean annual budget deficit-to-GDP ratios of 7%-plus through 2030, at which time the U.S. will surpass both Italy and Greece as having the highest debt ratio in the industrialized world. The S&P 500 price-to-sales multiple has expanded to 3.5x from around 3.0x a year ago and 2.5x two years ago and is nearly double the historical norm, with of course the most extreme measure being in the Tech sector, with over a 10x price-to-sales ratio.
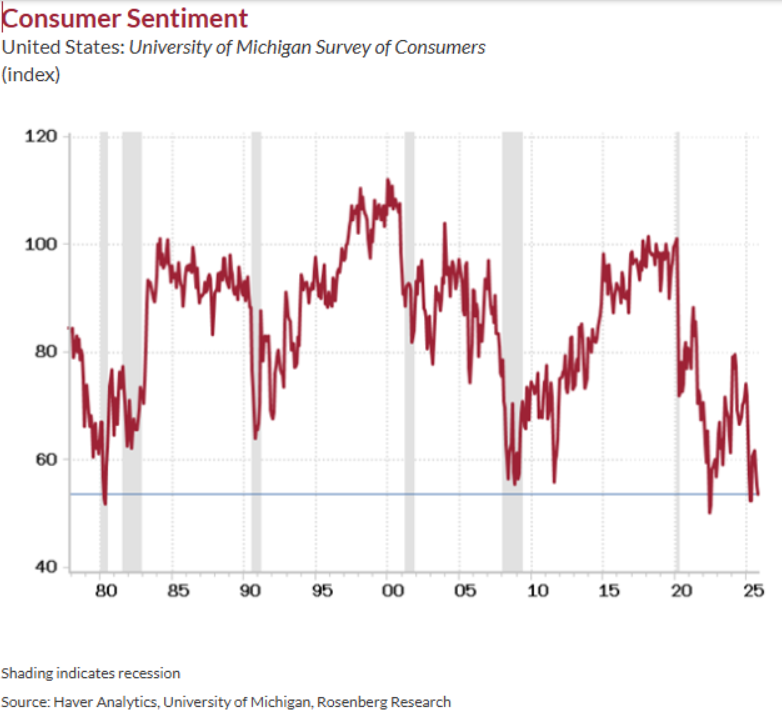
The paradox of economic data, which has been far less robust than the stock market bulls would have us believe. We don’t need government data to know what’s happening with the U.S. economy. The Fed’s Beige Book said it all: the share of the national economy that is still expanding has collapsed in the past six weeks to 18% from 43%, a marked difference from the 100% share of the economy that was at least expanding slightly or modestly at the turn of the year. While many claim that a recession is out of the question, real disposable personal income has contracted at a -1.2% annual rate over the April-August period. But real expenditures are up at a +2.7% pace because we have experienced an epic drawdown in the personal savings rate to 4.6% from 5.7%. This is simply a very real reflection of the power of the “equity wealth effect” on spending, all concentrated at the high end of the income echelon, as the lower and middle classes have not participated in this last leg of the consumer spending file. But spending predicated on bloated monthly financial statements as opposed to what the labour market delivers is a “low quality” consumer profile that deserves a low multiple to be attached to it. The University of Michigan headline sentiment reading is in the bottom 1% share of all time, at 53.6, or more than 37% below the long-run mean of 85. That number is worse than the most depressed readings in ten of the past eleven recessions! So why has the economic data remained positive? So, we looked at the equity sentiment index which, at 56.1, is above the historical average and never has this series been so high with the overall consumer confidence metric so low. Investors are spending based on the wealth they feel from stock market gains. This is far less reliable and sustainable than spending based on employment growth, which we believe continues to deteriorate during absence of economic data we are getting due to the government shutdown in the U.S. Only once since the end of the Great Recession have hiring intentions in the Business Roundtable survey been as low as they are today, and that was during the peak of the pandemic in the second quarter of 2020. The share of the U.S. economy in expansion mode these past six weeks, at 18%, is the lowest share since May 2020. The economy, at least qualitatively, is in a mild recession. The stock market doesn’t see it, but the bond market does!
How to invest when upward momentum is strong, but downside risks are elevated. We pulled out our playbook from the year 2000, a period in which we saw a similar risk-reward trade-off for stocks. During that period, we positioned our stock exposure in such a way that we could at least keep up with the indices when they rose, knowing that we would pick up relative performance during any pullbacks or weaker days. We have been reducing stock allocation overall but also just mitigating the downside risks by moving to lower valuation stocks that have earnings upside and some dividend yield. Since things on the macro scene are far more fragile than they appear on the surface, we have also retained our longer-term bond exposures. With Canadian 20+ year government yields at over 3.5% and similar maturities in the U.S. around 4.7% we find both as very good hedges to the stock market exposure as well as beneficiaries of our expectations of slower North American growth and further declines in the inflation rates to the 2% targets. The second monthly decline in Canadian GDP reported this morning just reinforces our case on this position. We also continue to shift stock holdings to more defensive low-beta concentration. We recently added to positions in telecom stocks (BCE, Telus), pipelines (Pembina, TC Energy), natural gas (Arc Resources,) and commodities (Sprott Physical Uranium, Nutrien and Interfor). In the U.S. we continue to hold core technology names at a reduced weight but have eliminated holdings in all of the consumer sectors as well as banks. Our only recent additions were in health care names such as CVS Health, Pfizer Inc and the U.S. Biotech ETF (XBI-US). In terms of our sector strategy on the technology group, we have reduced the overall sector weighting. We’re sticking with big names such as Nvidia, Alphabet and Meta, but at reduced levels and have eliminated stocks tied solely to data centre expansion such as Oracle, Celestica, Micron and AMD, while continuing to avoid the truly egregious areas of valuation and speculation such as Coreweave or Palantir. Rumours of the death of applications software is premature! In an otherwise buoyant stock market, especially in technology, one of the biggest group of laggards this year have been the big enterprise software vendors i.e. Adobe (ADBE), Salesforce (CRM) and Constellation Software (CSU) in Canada. We have recently added all three of these names to our tech holdings. The worry is that the growing implementation of AI (i.e. the ‘inference stage’) will bypass the need for the applications that these companies have embedded in their enterprise clients. We think this view is misguided. While AI will change how these systems are used, companies are highly unlikely to rip out core systems that have been running most of their operations for the past two decades. Moreover, the speed of adoption may be overestimated at this point, and the companies would be reticent to give up the productivity gains from their existing systems.
1 2
Our investment management team is made up of engaged thought leaders. Get their latest commentary and stay informed of their frequent media interviews, all delivered to your inbox.