Keep connected
Our investment management team is made up of engaged thought leaders. Get their latest commentary and stay informed of their frequent media interviews, all delivered to your inbox.
John Zechner
May 30, 2019
While the early January reversal in the outlook for interest rates from the U.S. Federal Reserve was the ‘match that lit the fire’ for the 2019 stock market rally, the expectation of a trade agreement between the U.S. and China (and a subsequent end to the myriad of associated tariffs) has been the ‘fuel’ to keep the fire burning. That flame was effectively ‘doused in May as the Trump administration failed to put an agreement forward and the Chinese trade delegation returned home empty-handed. While the U.S. administration continues to claim that a deal could still happen, the Chinese state media now has ‘amped up’ the rhetoric against the U.S. claiming that “at the negotiating table, the U.S. government has made many arrogant requests, including restricting the development of state-owned enterprises. Obviously, this is beyond the field and scope of trade negotiations, (and) touches upon China’s fundamental economic system. This demonstrates, that behind the trade war the U.S. has launched against China, there is an attempt to violate China’s economic sovereignty, (and) compel China to damage its own core interests.” It’s hard to see those comments as any sort of ‘olive branch’ to re-open talks. While, in our view, the stock market has yet to fully incorporate the severe risks to global trade and growth from this breakdown, investors have certainly begun to pay more attention to these risks in the past month as stocks have begun to break down.
On top of the trade risks, the economic data continues to deteriorate. We have a litany of examples of weaker numbers in most geographies including falling Purchasing Managers Indices, negative export growth, weak durable good sales, declining capital spending (check the latest capex intentions from industry bellwethers Fedex and Caterpillar) and reduced earnings forecasts, especially in key cyclical sectors such as retails sales, autos, housing and manufacturing. But the bigger tell-tale signs are in the leading commodity markets. If growth is still strong then why are both copper and lumber prices down so far in 2019? There are not any commodities that are more closely tied to global growth trends. One could argue that oil prices have been strong so far this year, but that strength comes from supply-side issues as opposed to demand growth. Other ‘real world’ indicators of slowing growth include semi-conductor sales, which are down 26% year-over-year, worse than they were in 2008! The bottom line is that the U.S. Cycle Indicator (shown below) is looking very ‘toppy’ as it rolls over after nine years of repair, recovery and then expansion to downturn.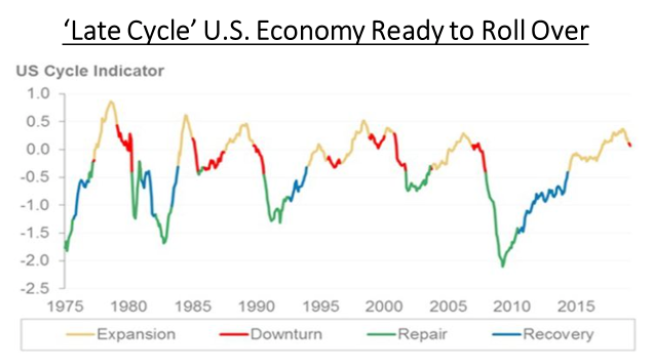
Stock investors, though, remain bullish as they are still convinced that either the U.S. will reach a trade deal with China or that the U.S. Federal Reserve will come to the rescue, with 73% of those surveyed expecting a rate cut this year and 26% actually expecting two interest rate cuts in 2019. How could that expectation possibly jive with continued economic growth? Moreover, there has been a growing disconnect between stocks and bonds. While the stock market has rebounded and climbed to a new high this year, long-term Treasury yields haven’t staged a similar recovery, remaining well below their recent November peaks. The yield on 10-year government bonds has fallen below the yields on 3-month Treasuries. When long-term yields fall below short-term yields, it is known as a yield-curve inversion and that has always been seen as a recession indicator. In March, yields on 10-year Treasuries fell below those on 3-month bills for the first time since 2007.
But there seems to have been a general feeling among investors seems that the underlying market action is constructive since stocks are down less than 5% from their peak despite five weeks of losses, initiated by the deteriorating US/China trade prospects. We would argue that the underpinnings of the stock market have been weakening more than the major indices indicate. Breadth factors i.e. the measure of the participation of a broad number of stocks to sustain any advance, continued to show further decay, particularly amongst the mid- and small-cap indices. The Russell 2000 Index in the U.S. has broken down and is close to 10% below its peak just a month earlier. It’s also noteworthy that the ratio between the large- and small-cap indices has pushed a new 6-month high, meaning that the gains have become much narrower, typical of the late stages of any market advance when fewer and fewer stocks contribute to the gains. The stock market has also been kept afloat due to a broad rotation into defensive sectors such as REITs, utilities and consumer staples. But the valuations in those sectors have now moved near all-time highs, most likely in anticipation of some cuts in interest rates, which may or may not occur. Another factor is that many institutions and large investors are reluctant to de-risk portfolios since they believe that President Trump could be one “tweet” away to announce a trade deal with China, a development that would send stocks much higher in their view. While the market would definitely rally on any such event, the S&P500 would be unlikely to push to new sustainable highs without great support from actual economic data or a massive dose of reflation delivered by world central banks. But those moves are also unlikely since central banks have almost no ‘wiggle room’ with interest rates already near record low levels globally (over $11 trillion of debt currently with negative interest rates) while fiscal initiatives are also a long shot since the major economies such as the U.S. and China have already ramped up debt to unsustainable levels. We continue to believe that stock markets have been in a peaking process for the past 18 months and the risk is higher that they finally break more sharply to the downside.
Canadian energy stocks still can’t catch a break. When oil prices were rising sharply earlier this year, Canada’s energy sector also rose but did not match the gains in the commodity. Then, when global oil prices suffered a slight setback in the past few weeks amid rising global trade tensions, Canadian energy stocks basically gave back most of the year’s gains. Capital continues to exit the sector as further demonstrated by the recently announced sale by Devon Energy of its Canadian heavy oil assets to Canadian Natural Resources for $3.8 billion. That basically completes the exodus of the major foreign players in the Canadian space. This also comes despite the fact that the Canadian energy companies are finally starting to do what they’ve needed to do for a long time, which is to stop pushing for growthat the expense of diluting shareholder value and instead focus on returning capital to shareholders. Encana Corp, Crescent Point Energy, Cenovus, Baytex Energy and MEG Energy are all Canadian producers that have started to use their excess cash flows to either pay down debt or begin to buy back their own stock. With free cash flow yields now in the ‘mid to high teens’ these stocks have become clear buys in our view. While some patience may be required to crystallize these values, as money managers we have never seen a case where these kinds of under-valuations weren’t ultimately recognized and rewarded.
New Hedge Fund position: Long Disney and Short Netflix. We recently covered a short position in Tesla (probably a bit pre-maturely) but are seeing a similar trend and opportunity in Netflix; excessive valuation, huge negative operating cash flow, rising debt and a growing list of new competitors in the business that will hamper growth and put profit margins under pressure. Netflix is spending over $9 billion on new content this year in order to keep their content fresh and avoid losing market share to newer streaming competition from HBO Now, Disney Plus, Amazon Prime, YouTube, Hulu and a host of others who all recognize that streaming is becoming the preferred viewing habit of most consumers. With Netflix stock trading at over 80 times forward earnings expectations, yet generating negative free cash flow due to the need to continually upgrade their content, we see risk in the stock. Since industry growth is strong though, we are hedging that short with a long position in Disney, which is trading at under 20 times earnings and has recently introduced a streaming service (Disney Plus). Also, in a world where ‘content is king’, Disney is in great shape with the Disney library and additional franchises such as Marvel Comics, Lucasfilms (Star Wars), Pixar and recently-completed purchase of major Fox Media assets.
Pot Hangover! Elsewhere in the Hedge Fund, we maintain a short position in the marijuana producers in Canada due to excessive valuations and investor growth expectations that we also see as too optimistic. Some of this optimism may get dialled back soon as Health Canada released March cannabis sales data that shows moderate growth, ample production, a substantial inventory build and a lack of finished product. Clearly, cannabis sales aren’t growing nearly as rapidly as most expected, and the industry is quickly headed for oversupply, if it isn’t there already. On an annualized basis, sales have reached 106k kg, still well behind consensus 2019 sales forecast of 250-300k kg. Since legalization, recreational sales have grown at ‘just’ a 6.3% monthly CAGR (compound annual growth rate), while medical sales have fallen at a 1.5% monthly CAGR. Sales should improve as new stores open and processing constraints abate, but analysts are increasingly likely to cut their 2019 sales forecasts again. Supplies, on the other hand, have been ample, which has lead to a solid build-up in inventories of product which could ultimately put some downward pressure on prices. Given all of this, it’s hard to see the stocks delivering revenue and earnings in line with expectations and just re-enforces our negative positioning on the sector.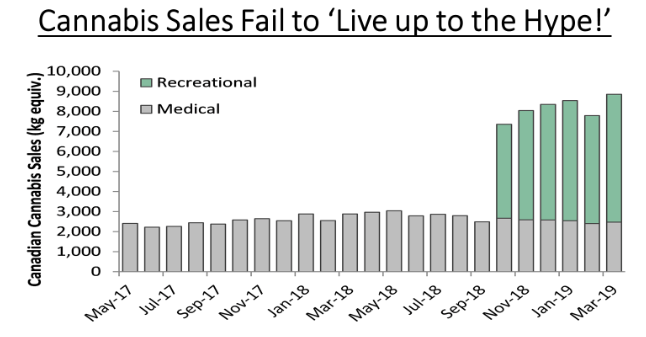
Our investment management team is made up of engaged thought leaders. Get their latest commentary and stay informed of their frequent media interviews, all delivered to your inbox.