Keep connected
Our investment management team is made up of engaged thought leaders. Get their latest commentary and stay informed of their frequent media interviews, all delivered to your inbox.
John Zechner
December 31, 2020
Many corners of the global economy have exhibited near V-shaped recoveries since the pandemic lows, and expectations are for continued strength as vaccines roll out, stimulus remains in place and consumers engage in some ‘pent-up demand’ for services. While the severity of the lockdown in March and April lead to such a massive decline in economic growth (worst since the 1930’s depression), it seems no surprise that the re-opening and recovery has lead to a similarly sharp move in the economic data. As can be seen from the chart below of the economic data in the major economies over the past 15 years, the data also had an initial V-shaped recovery after the Financial Crisis in 2008. However, after that initial sharp recovery, the overhang of debt and a reticence of business spending kept growth below normal recovery levels for the rest of that expansion. Even China’s growth rate lost momentum in the past decade, falling from low double-digit growth rates to as low as 6% prior to the pandemic. Those muted global growth rates did keep interest rates low, though, which fueled the bull market in financial assets such as stocks. After the initial surge next year, we believe that the recovery will again slip back to a lower growth mode, primarily because economic stimulus measures will have to be slowly withdrawn due to the overhang of debt needed to fund the expansion.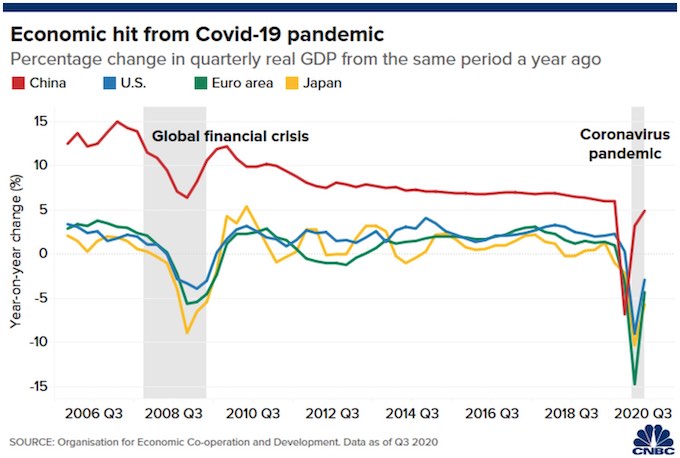
Meanwhile, with real rates not falling anymore, higher inflation expectations will pushup up 10-year bond yields. We estimate upside in the 1.2% to 1.5% zone for treasury yields next year and we are therefore underweight bonds in our managed portfolios and have a short position in U.S. long-term Treasury bonds in our Hedge Fund. The chance of a tactical correction in stocks remains very high as risk assets in all categories are extremely overextended after their sharp rally since early November. Nonetheless, the elevated likelihood that more fiscal stimulus will come to fruition around the world as well as the still ample global liquidity conditions together argue that the correction in risk assets will prove temporary and that the S&P500 is unlikely to decline much more than 10% because the earnings outlook for 2021 remains positive. Moreover, trying to ‘time’ the top in any bull market is a very nebulous endeavour and more likely to result in investors missing further upside than being to accurately catch any inevitable sell-off. We continue to believe that ‘what you own’ rather than ‘when you’re invested’ will matter much more in 2021. To that end, we continue to favour cyclical, under-valued stock sectors such as energy, some industrials, consumer cyclical stocks and financials.
We also believe that the growth sectors that have lead stocks higher for most of the past decade will lag their ‘value-oriented’ peers in 2021. Treasury yields and other benchmark interest rates tend to rise during an economic expansion to reflect higher inflation. Those higher rates lower the value of future corporate profits because analysts use a “discounted cash flow analysis” to assess the intrinsic value of a company. When rates rise, those future cash flows are discounted at a higher rate and therefore worth less today. Since growth stocks are reliant more on future cash flows, they are more sensitive to these interest rate changes. If a long-term increase in rates is indeed in the offing, as we expect, then ‘value’ could outperform ‘growth’ for years. Thanks to a greater likelihood of fiscal stimulus and the vaccine rollout, the recovery should begin to take hold later in 2021, but the U.S. Fed at its most recent meeting suggested that the economy needs a little bit more accommodation. In essence, while the Fed continues to add to the global liquidity pool, its marginal liquidity additions are decreasing. This suggests to us that real interest rates are unlikely to move below their summer lows. This also means that assets extremely sensitive to marginal liquidity conditions, such as the hyper-growth stocks, may be living their final heydays. Translation; we wouldn’t count on gains in Zoom, Tesla, Peleton, Docusign, etc. to match anything close to their 2020 gains and are more like to lag the overall market. Nonetheless, beyond these few extreme cases, stocks should weather this marginal tightening in liquidity conditions and still generate positive gains next year.
Corporate America is flush with cash! Based on several metrics, corporations have rarely set aside as much cash for rainy days as they did in the current crisis. For instance, cash as a percentage of assets for all U.S. corporations hasn’t been this high since the 1950s, while cash as a percentage of total debt is at levels last seen in the 1960s. Although these high cash positions are skewed towards the ‘mega cap’ names, even the average S&P500 company has seen its cash balances exceed the levels reached during the last big scare of the financial crisis. Overall, we believe corporate America will face increasing heat to use that excess cash in various ways (debt repayment, capital spending, mergers/acquisitions, share buybacks or dividend increases). More capex in particular would certainly give a much-needed boost to the economy. Consumers are also somewhat ‘flush’ despite the pandemic. Collectively they are sitting on more than $1 trillion in “excess savings” over and above pre-Covid levels. A lot of this cash could spill into a recovering economy, particularly services such as travel and leisure, adding further to the rebound expected in 2021.
2020 Economy: people were ‘getting things’ instead of ‘doing stuff’. The pandemic has changed much about consumer activity as well all know. While the initial lockdowns seemed to put a damper on all type of business activity, the ensuing government and central bank actions helped lead to a recovery in spending, but one that was focused entirely on the ‘stay at home’ economy and highly tied to the ‘goods economy’, benefitting housing and home repair, auto parts and manufactured goods. We expect some reversal of those trends in 2021 as the vaccines are rolled out globally, with recoveries for service industries such as the beleaguered travel industry. We have recently added to industry leaders with strong capital positions, recovery potential and manageable cost structures such as Air Canada and Norwegian Cruise Lines. The chart below shows how goods and services have both recovered off the spring lows, but services remain down over 5% still for the year while good production rose over 10%.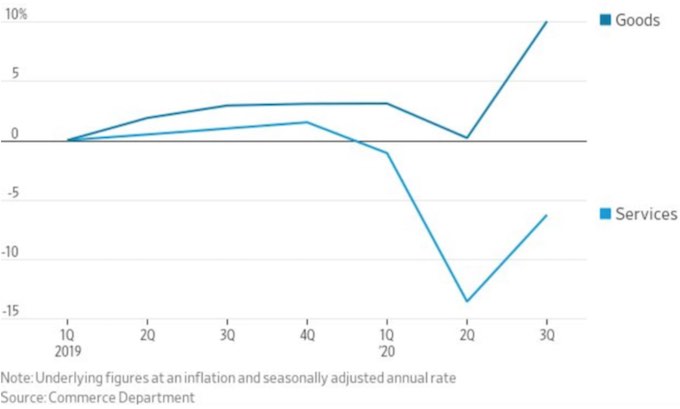
Our investment management team is made up of engaged thought leaders. Get their latest commentary and stay informed of their frequent media interviews, all delivered to your inbox.