Keep connected
Our investment management team is made up of engaged thought leaders. Get their latest commentary and stay informed of their frequent media interviews, all delivered to your inbox.
John Zechner
November 4, 2025
A major discussion point with investors recently has been whether we are in another stock market ‘bubble’ in the world of artificial intelligence. The bullish rebuke on this matter is that we can’t possibly be in a ‘bubble’ when so many people believe we are already in one and it is so widely discussed. There is no consensus on whether the current AI market is a bubble, with many experts pointing to signs of a potential bubble, such as high valuations and investor hype. Others argue that the massive investments are justified by AI’s transformative potential and the real-world infrastructure and profits it is generating, making it different from past speculative bubbles. The market has seen a massive influx of capital, and while there may be winners and losers, some believe the overall investment is necessary and productive, unlike the dot-com bubble. In our view, this entire discussion about whether we are in ‘an AI bubble’ misses the point to a large degree. Whether or not this will or will not end up being defined as a ‘bubble environment’ like that in the late 1990s won’t be known until long after the fact. Just like trying to discern whether an economy is in a recession, by the time it is officially recognized, it is all well in the rearview mirror and no longer relevant for the movement of stock prices. The bigger question investors should be asking themselves today is what the risk-return parameters are around owning stocks right now versus other asset classes such as bonds, hedge funds or cash? On that point we feel strongly that stock market risks are currently skewed to the downside.
Valuations by almost all measure are at record levels while the positioning of investors is also full, with over 70% of the financial assets of U.S. investors in stocks, an all-time high! While high valuations alone are not recognized as catalysts to cause a downturn, they do set the boundaries for how far we can go in each direction. Stocks have clearly exceeded historical valuation levels on the upside and could easily rise further given the strong momentum. But stocks did tend to overshoot in both directions so that ‘the higher they rise, the harder they fall!’ We should not forget that it took stocks like Microsoft 15 years to re-achieve the levels they hit in 2000 prior to the deflation of that tech bubble. Moreover, it’s not like the company didn’t report strong growth in that period from 2000 to 2015. There was no social media, no streaming and very little cloud activity in 2000. All of that developed in the 2000-2015 timeframe and it took Microsoft that long to recover from the excessive overvaluation it reached in 2000. Another measure that increases our view that stock market risks are skewed to the downside are the sentiment indicators. While, like valuations, they are not necessarily great timing tools or catalysts in and of themselves to market downturns, extreme readings have coincided in the past with stock market tops and bottom. We see that again today as the Market Vane Bullish Sentiment Index is pressing against 70%, which is near the very high end of the historical range. Also, the share of bears in the Investors Intelligence Survey, at 13.5%, is close to the lowest level ever recorded. The last time we were anywhere close to this was in January 2018 when announced tax cuts were causing a major bout of exuberance, which pales compared to what we are seeing unfold today. Nonetheless, by December 2018 the S&P500 had fallen 20%! On top of sentiment and valuations, investor behaviour is also at prior extremes. Cash levels recently hit their lowest as a percentage of assets under management in more than a decade, according to Bank of America’s regular surveys of fund managers. This has been a consistently good indicator for both market tops and bottoms. On the latter, we saw the same survey show cash as a percentage of assets under management hit peaks during months such as May 2000, December 2008, June 2012, April 2020, October 2022 and this past April, which were all after stocks had suffered big selloffs. That is partly explained by fund managers raising cash to meet anticipated redemptions, but it also reflects unhealthy pessimism. The opposite is happening right now. Another cyclical low was in early 2000, just before the tech bubble burst. The trough before that was in the early 1970s, right before another nasty bear market. Low fund cash levels add to evidence that stocks are prone to a reversal.
For now, the bull market remained intact as the U.S. markets continued to grind higher in October, driven primarily by the strength in third quarter earnings reports. Canadian stocks were more limited in their gains as the impact of the retreat in gold prices had a much bigger impact on the averages up here. The proportion of U.S. companies beating earnings expectations this quarter is the highest in more than four years, providing stock investors with relief at a time the rally is slowing. About 85% of S&P 500 firms to have reported third-quarter earnings so far have surpassed profit estimates, on course for the best performance since 2021. The beats came from various sectors. Among banks, Citigroup Inc. and Morgan Stanley surpassed estimates. Meanwhile, General Motors Co. soared after raising its profit guidance on buoyant truck sales and some tariff relief. Ford Motor also beat expectations and raised forecasts for the balance of the year. The reduction and delay of some U.S. tariffs were a clear benefit for the U.S. auto industry. Coca-Cola Co. also topped expectations as consumers snapped up the company’s beverages despite higher prices.
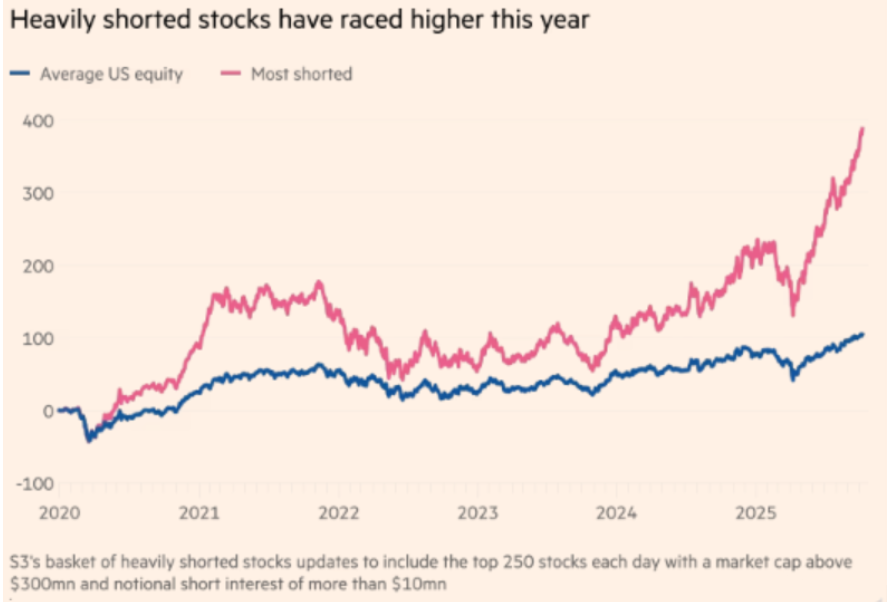
On the interest rate front, both the Bank of Canada and the U.S. Federal Reserve did what investors expected at their October 29th meetings, which was to cut interest rates by another ¼ point. However, both central banks were also reticent to say that there will be more easing in the immediate future. The Bank of Canada described current rates as “appropriate” to address both the weakened economic conditions from the current trade turmoil while still controlling inflation as it moved towards its 2% target. U.S. Fed Chairman Jerome Powell then threw a bit of cold water on expectations for a further rate cut at their December meeting, saying that it “was not a foregone conclusion” and “quite far from it.” This could take away one of the strong tailwinds for stocks over the past numbers on months, namely that investors could look forward to a series of interest rate cuts over the next year. Beyond that, basically all news has been ‘good’ as far as the stock market is concerned. First, we saw that good (economic) news was good for stocks since it meant earnings growth. Then the data worsened but ‘bad news was also good news’ for stocks since it meant the Fed would get more aggressive cutting rates. Now, with the government shutdown, we also find that ‘no news is good news’ for stocks, with the absence of economic data the assumption seems to be that ‘everything is good.’ But the non-government reports (ADP, ISM) have all shown more weakness during the hiatus of official numbers so we think that once the data does start to flow again, it will highlight the downside risks. Certainly, the announcements of massive job cuts by some larger U.S. corporations (15,000 for Amazon, 10,000 for UPS) are pretty good indicators that the employment data has continued to weaken during the ‘data hiatus’ caused by the shutdown. Meanwhile, speculative activity continues to flourish in the stock market. One interesting indicator of the increase degree of risk taking and speculative activity by investors is the fact that some of the ‘junkiest’ names in the index have been the ones generating the largest gains. The chart below shows the substantial outperformance recently by the ‘most shorted’ stocks versus the average stock. That divergence really took hold after the rally following the ‘Liberation Day’ selloff in early April. The last time we saw a similar pattern was in the mid-2020 to late 2021 period, just prior to the full correction of stocks in 2022.
1 2
Our investment management team is made up of engaged thought leaders. Get their latest commentary and stay informed of their frequent media interviews, all delivered to your inbox.