Keep connected
Our investment management team is made up of engaged thought leaders. Get their latest commentary and stay informed of their frequent media interviews, all delivered to your inbox.
John Zechner
October 1, 2025
The phrase “defying gravity” has both a literal and a metaphorical meaning. Focus on the latter and welcome to the 2025 stock market! From the April ‘Liberation Day’ lows, the S&P500 has ripped +33%, adding on +$15 trillion of market value, which is about equivalent to 50% of Gross National Product, notching 26 record highs in the process, a feat only accomplished four other times since 1950. The recovery has not been limited to only the U.S. though, as the MSCI World Index, which tracks stocks across developed and emerging economies, has also hit an all-time high. In another sign of increased risk taking, emerging market stocks have outstripped the global index in 2025, underscored by the stellar performance of junky small caps of late. Valuations are extreme across any measure and sentiment is unapologetically bullish: the most recent bull share in the Investors Intelligence poll rose to 58.5% while the bear camp steadied at 17%, putting us back to more than a +40-percentage-point spread, which in the past was a danger zone. But few seem to see the danger inherent in the herd mentality; fund managers have put an amazing +$58 billion to work in the market through the past week as their cash ratio fast approaches unheard-of lows of 1%.
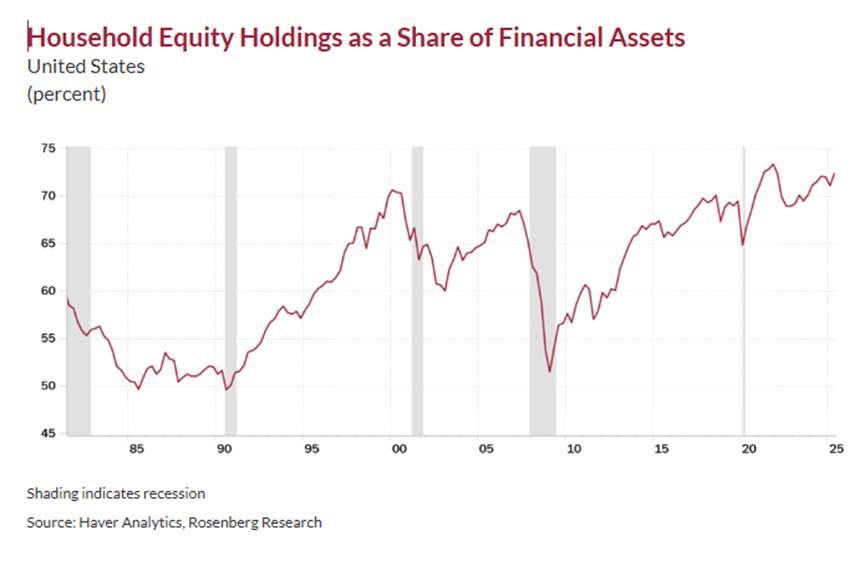
On a trading basis, though, short term momentum is turning down. The S&P500 registered its most overbought reading in 14 months just as momentum was waning and market breadth was flagging. The rally had fed fully off the known positive catalysts of a Fed cutting rates in a steady economy, with the AI-investment theme running hot but losing its power to impress. Seasonal patterns suggested caution, with some supportive flows and options positions due to roll off. Still, the slippage in the indexes has so far been orderly and modest. While the “froth pockets” of speculative quantum-computing, alternative-power, AI-supply-chain and crypto-treasury companies reverse and bleed lower, the core big-cap complex is mostly churning and rotating. Market breadth is weak but not a washout, around three stocks down for every stock rising. However, we see some cracks in the quality of this advance that suggests the risks are to the downside as potential economic weakness from the tariffs is not factored into earnings expectations. The investing public has clearly bought into the recovery though, and their exuberance is somewhat frightening. Over 62% of U.S. assets are now in stock related investments, a record level! Valuations may not exactly be great timing tools, but market breadth is, and it has peaked out and rolled over.
Maybe valuations don’t matter or aren’t reliable catalysts for stock market weakness, but it is getting harder to ignore some of the egregious readings on some well followed indicators, including the gauge dubbed as the ‘Buffett indicator.’ It measures the total value of publicly traded U.S. stocks (Wilshire 5000 index) against the nation’s gross national product. In a 2001 Fortune op-ed, Buffett called the indicator “probably the best single measure of where valuations stand at any given moment. If the percentage relationship falls to the 70% or 80% area, buying stocks is likely to work very well for you,” Buffett said in a 2001 speech after the indicator had neared 150% the year prior during the Dotcom bubble. “If the ratio approaches 200% — as it did in 1999 and a part of 2000 — you are playing with fire.” At a whopping 217%, it now sits well above the peaks reached during the Dotcom Bubble, as well as the pandemic-era rally in 2021 when it topped 190%.
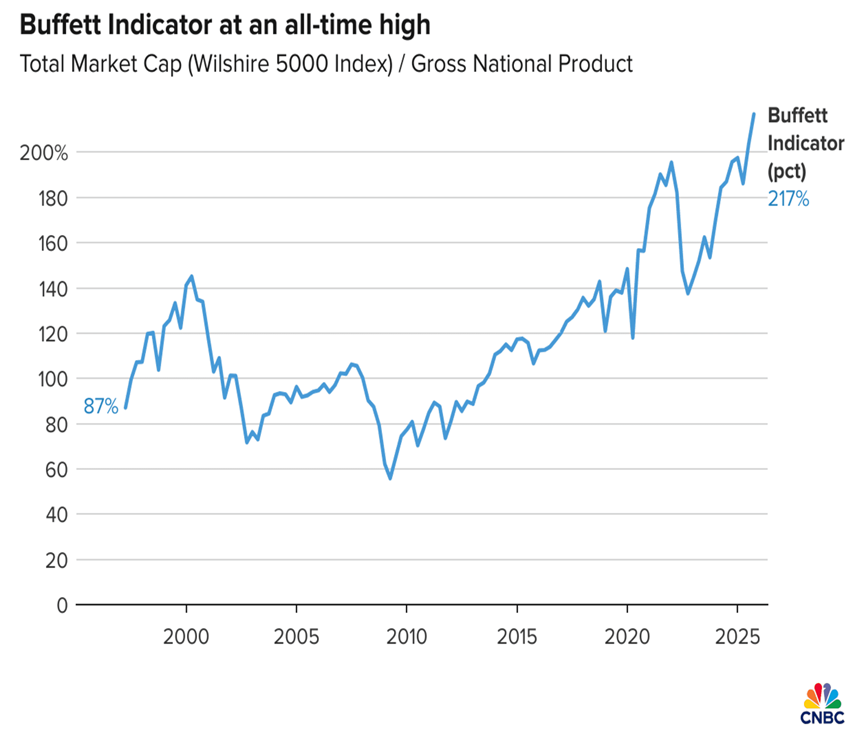
By that standard, the stock market today is in uncharted waters as equity values are now expanding far faster than the growth of the broader U.S. economy. The market rally has been fuelled by mega cap technology companies, which have ploughed billions of dollars in development of artificial intelligence, as they are rewarded with rich multiples for the promise of this new era. Other valuation gauges are flashing similar signals. The S&P500′s price-to-sales ratio recently climbed to 3.33, an all-time high, according to Bespoke Investment Group. For comparison, the Dotcom peak in 2000 topped out at 2.27, and the post-Covid boom reached 3.21 before valuations cooled. Still, some have argued that the Buffett Indicator may no longer carry the same message it once did. The U.S. economy has shifted dramatically over the past two decades, becoming less asset-intensive and increasingly powered by technology, software and intellectual property. Another good long-term valuation indicator, the Shiller smoothed P/E multiple (CAPE) expanded in August for the fourth month in a row to nearly 38x, the highest it has been since December 2021 (which touched off the big 2022 drawdown). Outside of that, it was topped only during the peak of the 1999-2000 tech bubble
“History may not repeat itself, but it rhymes.” The famous quote that was widely attributed to the American author Mark Twain may not have been meant as a reference to the stock market but is worth remembering since we keep hearing pundits say that you can’t compare the current bull market in tech stocks to the ‘Y2K’ tech bubble in 2000. The bullish argument contends that today’s tech giants are cash generating machines with massive cash balances, huge free cash flows and substantial market domination versus that prior era when so many ‘dot com’ companies had no earnings or even revenues. No argument on that point, but we are seeing some more similarities to that era that bear watching in terms of investor exuberance over a shift in the innovation curve, extreme valuations, rampant bullish sentiment, low liquidity ratios, market concentration and leverage. It’s not the same, but it is similar. Key in that regard is the increasing ‘recycling of money’ back into higher sales that lead to an unsustainable upward spiral that eventually unwound with expected negative results. It conjures up the image of Nortel and it’s like back in the late 1990s, when there was this aura of invincibility in the world at the time of ever-growing demand for telecom equipment to feed the Internet boom. Like then, the leaders got involved in tying their business to their suppliers, triggering financial and business concentration risks that we only saw unwind in dramatic fashion when the tide rolled out. In just the last few weeks, we have seen Nvidia, with its massive cash hoard, almost act like an investment bank, announcing it would invest $5 billion in Intel, after taking a 7% stake in CoreWeave (cloud services provider); and now making the earth-shattering announcement that it will move to invest as much as $100 billion in OpenAI to help finance a historic data centre build-out. NewStreet Research analysis shows that for every $10 billion Nvidia invests in OpenAI, the startup will spend $35 billion on Nvidia chips. This is reminiscent of the old story about two pig farmers who keep selling the same pig to each other. If you are looking for an ‘early canary in the coal mine’, this is certainly one to consider and has a familiar ring to it. The bigger question is what and when the expected future payback on this massive spending spree is going to be?
Sentiment is always a tough narrative to define accurately. The stock market bears say, ‘everyone is bullish’ while the bulls say, ‘everyone is bearish’, so we should look beyond these purely emotional sentiment readings and to the actual positioning of investors to see the true ‘walk the walk’ sentiment is. On those metrics, the top ten S&P500 companies make up 40% of the market cap (versus less than 30% at the bubble peak in March 2000), but the largest five command a 28% share! A decade ago, it was less than a 12% share. We have concentration risk layered upon concentration risk. The most concentrated company representation in 60 years with over half the market now dominated by passive index Exchange Traded Funds and a record 72% of the U.S. household financial asset mix in equities (only 7% in bonds).
1 2
Our investment management team is made up of engaged thought leaders. Get their latest commentary and stay informed of their frequent media interviews, all delivered to your inbox.