Keep connected
Our investment management team is made up of engaged thought leaders. Get their latest commentary and stay informed of their frequent media interviews, all delivered to your inbox.
John Zechner
May 30, 2025
Seven short weeks ago, markets were staring down the barrel of the third-worst four-day stretch for stocks over the past 25 years. From those lows, the S&P500 has since snapped back over 20% to lift it back into positive terrain for 2025 and since the November election. May then became the first month since January to show a positive return. The rebound was fired up by the U.S. Administration backing off from the most extreme tariffs and trade rhetoric, first by dialling down the reciprocal tariffs on April 9, and then by reeling in the triple-digit charges on China, both for a 90-day pause. Then, after threatening 50% tariffs on the European Union starting June 1st due to their slow response to trade talks, Trump once again delayed back that threat until July 9th two days later, after a call from the EU head saying they would enter more substantive negotiations. While almost nothing has been achieved in actual trade discussion, stock investors clearly see all this backtracking as part of a ‘negotiating tactic’ and are assuming that trade deals with get done. Of course, as soon as we start to see even a brief hiatus on the tariff front, we get a piece of new information that throws that throws a big wrench into that whole discussion as the Trump tariff file, including the 10% baseline levy, was deemed illegal and blocked by the U.S. Court of International Trade for surpassing his presidential authority under the emergency provisions regarding foreign trade (essentially, this lower court ruled that the White House wrongfully used an emergency law to lower this tariff boom on America’s trading partners). The administration will appeal this decision, up to the Supreme Court if necessary, and will most likely also look at other avenues for imposing their tariffs that don’t include having to declare emergency measures as justification. No matter how this ends up going, U.S. tariffs on imports are going higher and we still expect this to stunt economic growth in the second half of the year. Investors are behaving almost as if the trade war is over and done. The ‘low hanging fruit’ has now been picked in terms of cutting a trade deal with Britain, which has been desperate for any trade gains since leaving the EU back in 2015, and by projecting a lessening of visible trade tension with China by the mutual lowering of excessive tariff levels. While the trade news is no doubt less awful, it’s still far from reassuring. The question is, at what point will the President’s credibility become impaired because you only get so many tries at kicking the tariff can down the road? The court ruling will make it harder for the administration to get some of the trade deals done that they claimed were ‘very close.’ Bigger trade partners such as Japan, the EU and, of course, China have more incentives now to drag their heels even more since Trump’s ability to impose those excessive tariffs has been scaled back. But stock market investors are clearly paying less attention to the risks and see the net impact of all these permutations as positive and have bought into the belief that growth will continue, inflation will remain under control, the U.S. Fed will cut interest rates, and excessive valuations are not a good enough reason to avoid stocks. Bubble time!?
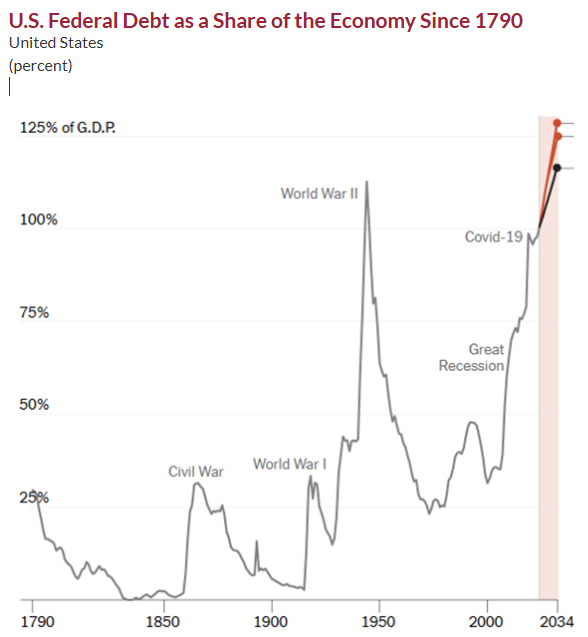
An entirely different reaction to the trade dispute is coming from the bond market. Long term government bond yields have shot back to the upside, once again piercing the 5% level. However, this is less a worry about higher inflation from a resumption of growth or reduction of trade tensions, and more about the worries over the expansion of government debt coming from the ‘One Big Beautiful Bill’ that passed in the US House of Representatives by a single vote. That has added to the term premium in bonds (extra yield required to offset higher risk) that this excessive borrowing will lead to. Rising bond yields have generally unwound stock market gains and lead to bear markets, most notably in 1987, 1990, 2007 and 2022. In this case, the bond market is telling the White House to cool its jets on the Trump desire to keep priming the fiscal pumps. The congressional leadership is totally undeterred by the latest credit downgrade or the fact that even at an AA+ rating by all three agencies, the United States has the weakest national balance sheet of any sovereign with a comparable ranking. After years of massive overspending, it should come as no surprise that fiscal worries are intensifying as the President pressures lawmakers from the bully pulpit to pass a new bill that could add over $4 trillion to the deficit over the next decade at a time when the federal debt-to-GDP ratio has already risen to record highs going back to 1790, taking out the prior World War II peak. In terms of how this impacts our current investment strategy, we default to the well-known adage from legendary investor Warren Buffet, who wrote “Be fearful when others are greedy and greedy when others are fearful.” From all we can tell, bond market investors appear fearful and stock market investors are looking greedy.
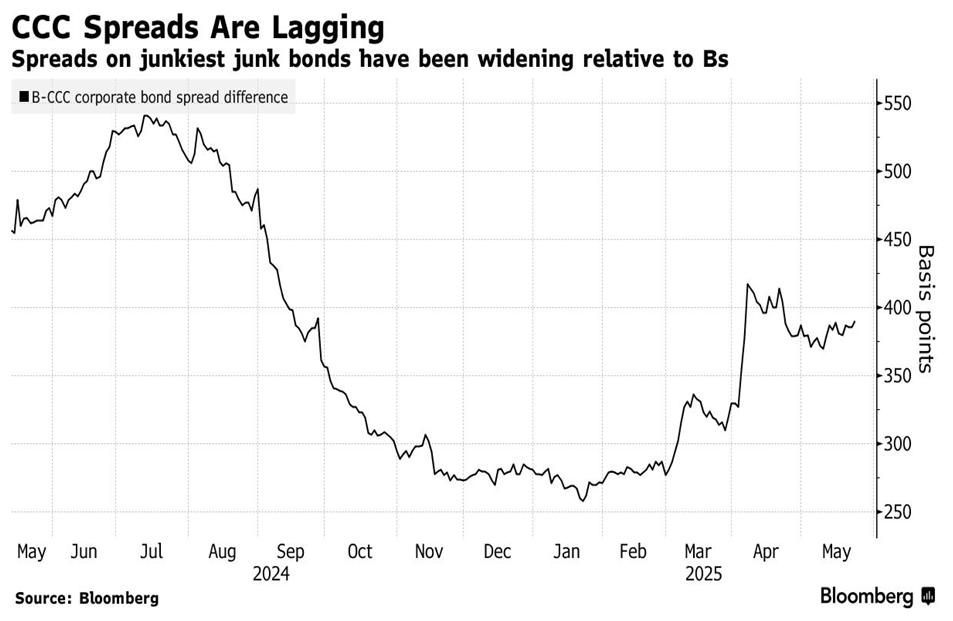
The direction of economic activity is the key to where interest rates, earnings and stocks ultimately go. We have heard so much discussion lately about the ‘soft’ vs the ‘hard’ economic data points. Investors need to be aware of the difference in the two measures. The ‘soft’ data point is what consumers and businesses think about the outlook while the ‘hard’ data points are what is actually happening economically. The former is much more volatile and strongly impacted by other volatile data, such as stocks prices. So, it should come as no surprise that, after one of the largest collapses in consumer confidence in history and a subsequent 20% recovery in stock prices, the consumer confidence measures have all seen a strong upward bounce. We believe the more important data points to watch are the hard ones that are leading indicators. Two hard data points that stand out right now are the housing and employment claims. Cracks are starting to form in the labour market with Initial jobless claims rising in the most recent week to 240k, while the backlog of continuing claims has been rising for three straight weeks to 1.919 million, the highest level since November 13th, 2021. On the housing market, the excesses in the residential real market are so acute that total housing units under construction have been forced to contract -15% over the past year to a four-year low. The NAHB homebuilder index yesterday for May and the weekly pending home sales data reflected the weakest spring season for housing ever outside the pandemic. Bottom line, real estate demand is contracting at an alarming rate. Stock investors have also yet to pay attention to weakening trends in the credit markets. Bond investors are getting ‘yippy’ as risk premiums on junk bonds rated in the CCC tier have widened 1.56 percentage points this year. The gap between spreads on CCCs and the next tier above them, Bs, has been widening, signalling that the weakest bonds are lagging. The CCC widening and underperformance are red flags since they indicate an overall weakening in credit trends, which bodes poorly for economic conditions and bank earnings.
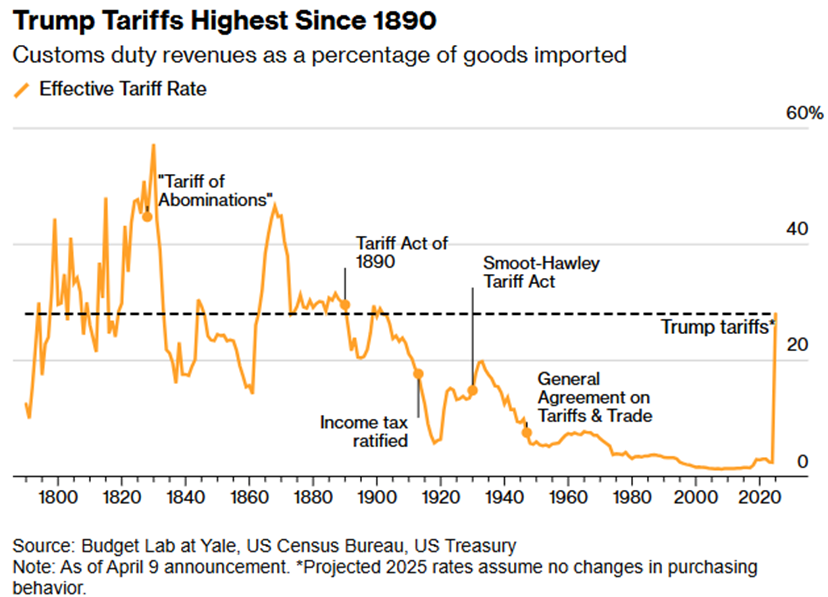
Stock market investors seem to have written off most of their worries during the rally of the past month, but corporate behaviour has clearly not followed suit. Companies, or those willing to make a prognosis, are not only pulling guidance for the year due to the uncertainty of tariffs, but they have also started halting share buybacks in favour of debt reduction or simply building up cash balances for the same reasons. We remain concerned that ‘buyer’s remorse’ is going to come into play before long, particularly once the full impact of the tariffs begins to show up in the actual economic data. Investors should remember that after the first round of ‘Trump tariffs’ in 2018, it took a few quarters before the data started to effectively reflect the negative impact and there is no reason to believe that won’t happen again. Especially with durable goods where retailers will often burn through pre-tariff inventory first before turning to higher-cost, post-tariff inventory. Consumers also try to ‘front-run’ tariffs, increasing purchases before they go in effect and reducing them just after tariffs hit. New orders made after the tariff may take weeks due to shipping times. All these factors lead to delays to the levies being reflected in new data. Another reason for the impact to appear only slowly is because tariffs often don’t typically ramp up to full strength immediately, due to delays in the collection of levies or pauses tied to pending trade talks. This is currently the case. Based on actual federal tariff revenue, the average effective rate in April was about 4.5% and preliminary data for May suggests it was around 6.5%. Current tariff policy, even after the China “pause,” suggests an average rate of 16% to 18% (and 21% to 22% if President Donald Trump follows through on his threat of 50% tariffs on the European Union). In other words, tariffs weren’t biting at full strength in April or May. More importantly this time around, the 2019 slowdown was from an increase in tariffs which was barely perceptible on the longer-term chart, as tariffs only rose to about 3% on average. Now, despite U.S. reciprocal tariffs falling to a blanket level of 10% for most countries, the U.S. effective tariff rate on US imports has gone through a tenfold increase. As such, we think the global economy could enter recession this year unless tariffs are reversed. A slowing in growth outside the U.S. is already underway and more softness should be expected due to tightening financial conditions and reduced U.S. imports. Trump has repeatedly professed his love of tariffs and vowed to use them as a tool to reverse trade imbalances, raise revenue for the government, and revitalize manufacturing in America. Still, as shown below, the scale of the import taxes, even under the court-imposed cancellations, will lead to the highest protectionist barrier around the U.S. in over 80 years!
1 2
Our investment management team is made up of engaged thought leaders. Get their latest commentary and stay informed of their frequent media interviews, all delivered to your inbox.