Keep connected
Our investment management team is made up of engaged thought leaders. Get their latest commentary and stay informed of their frequent media interviews, all delivered to your inbox.
John Zechner
July 1, 2024
“A day may come when” (sic) energy stocks trade up to normal valuations, when banks stop writing down bad loans, when small cap stocks see actual recoveries in their earnings and the entire stock market broadens far beyond the narrow leadership of a few, “but it is not this day.” With full apologies for the butchering of Aragorn’s Battle Speech to his soldiers at the Black Gate in “Lord of the Rings – Return of the King,” our point is that the trends that have dominated the stock market over most of the past eighteen months are not likely to change in the very near term. The tailwinds that we have seen for the growth sector of the market are still in place. Irrespective of the timing of the next move in interest rates in the U.S., the direction will be lower. That will continue to lend support to the elevated valuations of growth stocks. We also expect economic growth trends to slow down further, meaning that cyclical earnings will not increase and that will put a lid on cyclical stock sectors such as financials, energy, basic materials, industrials and consumer cyclicals, despite already low valuations. Moreover, while this continues to be a narrow market advance, with the ‘Magnificent 6’ up +50% year-over-year compared to +24% for the entire S&P500 Index, this has been justified by the fact that over 100% of the earnings growth in the past year has come from these six mega-cap companies. For the other 494 companies in the index, profits have contracted 3% over the year. Going forward we are still not finding much near-term upside outside of the technology group since earnings growth is less visible. Bank stocks are still seeing rising loan losses and you don’t have to look any further than some recent ‘short sales’ of real estate in NYC that the values are still well below the loan values. Small cap stocks continue to be laggards. Smaller companies tend to have a considerable amount of floating-rate debt, usually in the form of loans, because they often aren’t big enough to be borrowers in the bond market. That means their interest expenses often reset higher soon after the Fed hikes rates, while a bigger company with fixed-rate bond debt may wait longer before higher rates have a significant impact on their borrowing costs. In addition, the performance of small companies typically is tied to how the overall economy is doing. Small caps are increasingly money losers, with about 42% of the Russell 2000 currently posting negative profitability. Retail and industrial stocks, while inexpensive on a historical basis, face earnings challenges due to slowing economic growth and lower profit margins.
While the tailwinds all still favour the big tech stocks, it feels like we are in the ‘blowoff’ upside phase of the market bounce that started last November, not unlike the final runup we saw in the technology sector in 1999. We are getting into ‘rarefied air’ in terms of valuations. While valuations may not be a good timing tool, they are an excellent indicator of forward returns, and at these lofty levels, it is hard to envision how future expectations can be justified. There are some other warnings signs though that we should pay attention to. Investors last week reacted extremely positively to tech news that really wasn’t all that bullish in our view (i.e. Oracle, Adobe, Apple and Broadcom), suggesting that optimism is excessive. We have also seen increased selling of these large growth stocks from insiders as well as hedge funds. Meanwhile, the dollar impact of even small pullbacks in these big names is more substantial than anything we have seen before and could easily undermine overall confidence in the stock market. Nvidia, the poster child of the artificial intelligence revolution, slid over 12% from its peak less than a week earlier, shedding over $430 billion in market value in just three sessions. That’s the biggest three-day value loss for any company in history. But the turbulence resurfaces the question of whether cracks in zeitgeist momentum trades point to a tougher outlook for risk appetite as the prospect of higher-for-longer interest rates hangs over markets. Micron Technology Inc.’s post-results selloff sent a fresh reminder to global investors about the risks inherent in bets on artificial intelligence chipmakers. Days after leading AI chipmaker Nvidia Corp. slumped by nearly half a trillion dollars, Micron shares fell about 8% in extended trading after the memory maker offered a forecast that fell short of the highest estimates. The excitement about growth stocks has not just been limited to the technology sector. Growth stocks in other industries that have demonstrated resilient earnings and a growth story have achieved excessive valuations. Just look at retailer Costco, trading at over 50 times earnings or big pharma leader, Eli Lilly, trading at over 60 times forward earning on excitement over the outlook for GLP weight loss drugs!
The ‘rubber may be starting to hit the road’ in terms of the Artificial Intelligence (AI) story. In the most recent reporting period companies have seen that you need to do more than just talk about AI, you must deliver some growth in numbers. Nvidia and Broadcom did, and their stocks rose. Other chip names such as AMD, Marvell and Intel didn’t, and their stocks got crushed. But the bigger damage appears to be happening in the software industry, where AI spending is crowding out SaaS (Software As A Service). Witness the 18% drop in the shares of software giant Salesforce after the cloud software vendor reported weaker-than-expected revenue and issued guidance that trailed expectations or the 25% one-day plunge in shares of Workday. Both companies, as well as many other enterprise software vendors such as Snowflake, Intuit, Shopify, Adobe, Service Now, MongoDB and Open Text, have talked about how they were seeing their customers exhibit more budget scrutiny and longer deal cycles than usual and this has put some pressure on that group of stocks. To enable AI applications, companies have to make the switch from “general purpose computing to accelerated computing.” To meet that demand, an estimated 100,000 data centers would need to be built in this ‘arms race.’ AI infrastructure is underway with Amazon, Google, Meta and Apple spending a combined $200 billion to build out AI capacity, suggesting again that the early rewards will accrue mostly to those who have scale in data and capital. Nvidia is the clear winner in this infrastructure rollout. They maintain over 80% of the market with their H100 and next generation ‘Balckwell’ chip architecture and almost ‘unheard of’ gross margins of over 80%. Eventually this spending will slow down.
We keep hearing that the current ‘bubble’ (if you can call it that) in tech stocks is very different from what happened in the late 1990s. While we agree that the tech leaders today have real earnings and cash flow as opposed to ‘eyeballs’ and ‘dot com’ labels, there are also a lot of similarities that are not getting talked about! The final surge in the Nasdaq Index in 2000 was also very narrow, driven by the few large telecom and equipment companies that were building out the cable and fibre that would power the internet. Nortel, Lucent, Cisco and JDS Uniphase lead that charge and telecom newcomers such as Worldcom were paying for that expansion. However, once that initial backbone was largely completed, the sales from those giants fell off a cliff and only one of those companies is still around today, and it still trades almost 50% lower than its market valuation in the year 2000! We also hear about the next leg of spending on AI will accrue to the leaders in the ‘applications layer’ that will help implement the large language learning models that power AI. That is not unlike how we expected the software and web service companies in 2000 to take over the next phase of growth once the internet was built out. Companies such as Microsoft and Oracle were there, and they did grow throughout that entire ‘post Y2K’ era. But it took both of those stocks 15 years to get back to the levels that were at in 2000! Google (now Alphabet), Amazon and Facebook (now Meta) took over that next stage of growth, so it might be the same today that the winners from the growth of the ‘applications layer’ of AI are probably companies that have very little presence today.
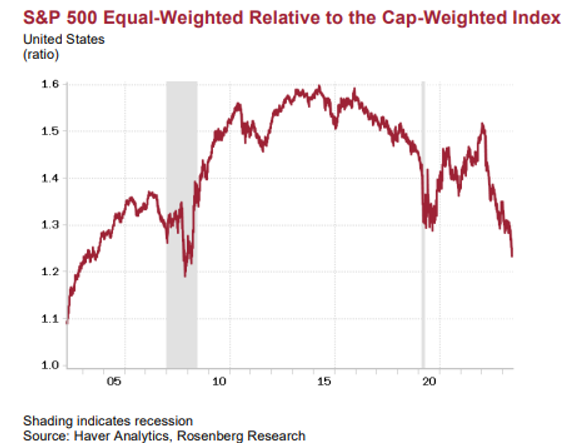
There was excitement last autumn with the ‘everything rally’ in the fourth quarter that suggested a newfound broadening of the gains to more sectors and stocks, but this has narrowed once again this year. It has been written often that “markets are strongest when they are broad, and weakest when they narrow.” From this perspective, U.S. markets are currently extremely fragile. For all the talk of a huge bull market, the average stock is no higher now than it was in early 2022. Meanwhile, the extreme valuations and concentration risk have not stopped investors from becoming even more ebullient, with the latest Investors Intelligence poll showing the bullish contingent rising to 61.2%, more than triple the depleted 17.9% bear share. Spreads of more than 40% in favour or bulls has always occurred with market tops. The S&P500 Equal Weight Index compared to the S&P500 Index (pictured below) is narrower than at any time since the year 2000 when the internet bubble was imploding.
While we can’t predict how long this ‘blowoff’ stage of the stock rally will last, what we are most certain of is that the economy is slowing down. Despite the sharp rise in interest rates in 2022, the economy had not yet been derailed in the U.S., even though we have seen significant weakness in the rest of the world. Clearly, there was still a lot more ‘gas in the tank’ than most forecasters realized in terms of stimulus, including pandemic payments and a 6% fiscal spending deficit fueled by massive spending programs on infrastructure. We also believe that many forecasters, ourselves included, have underestimated the impact of the ‘wealth effect’ in supporting spending. The U.S. stock market is valued at over 140% of GDP, a fourfold increase from the ‘sub-40% level four decades ago. This means a massive support for spending, but only for those who have these savings/investments. This has resulted in what could only be called a ‘K-shaped’ recovery, as opposed to views of a ‘hard’ or ‘soft’ landing of economic growth. This refers to the reality that lower end consumers have been more negatively impacted by inflation on core goods such as food and inflation, since they make up a larger portion of their overall budgets. Higher end consumers have been insulated by the fact that those basic goods are a smaller part of their overall budget plus the fact that they tend to have excess savings or investments which have benefitted from the rise in interest rates and strength in the financial and housing markets. This is seen in spending on services (travel) and luxury goods. Why then are we now seeing consumer confidence dropping in key surveys from University of Michigan or the Conference Board? We believe that stimulus is starting to run down, and savings rates have been cut in half so that source of spending is drying up. We have seen a slowdown in job growth in the weekly claims data and a drop in job openings in the JOLTS data. Meanwhile, inflation continues to negatively impact those in the lower income brackets. Stall-speed is now the operative word which is why growth stocks are beating cyclically sensitive value stocks, because when growth becomes scarce, it starts to garner a relative premium. The incoming data have been so soft that they compelled the Atlanta Fed to cut its second quarter real GDP growth forecast to +1.8% from its rosy +4.2% projection in mid-May. Last week we got more fuel for our economic slowdown thesis: weekly employment claims, which are a better leading indicator than payrolls, rose again last week and the four-week average is starting to break out to a higher range and got dismal readings from U of Michigan Consumer Sentiment Surveys which were well below expectations and back down to 2-year lows.
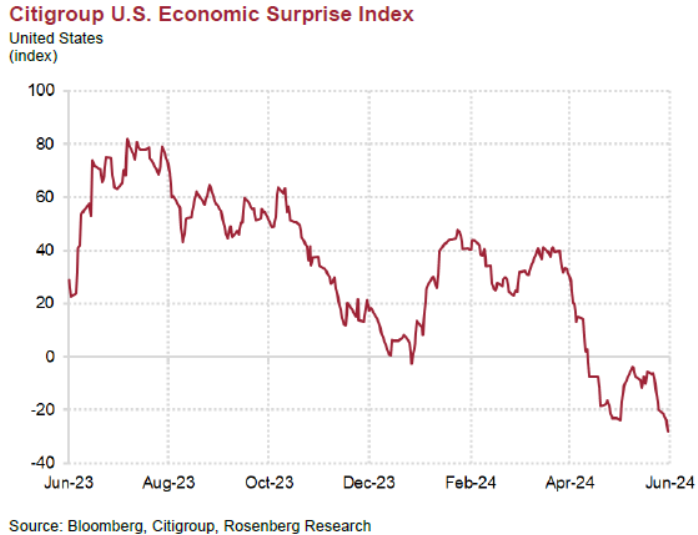
While we have seen central banks outside of the U.S. (ECB, Bank of Canada and Swiss National Bank) make their first downward move on interest rates, we have not yet seen similar moves from the U.S. Federal Reserve. Is the U.S. central bank missing the evidence and risking moving too late on interest rate cuts? The weakness in the consumer can now be considered a “trend” seeing as we saw real retail sales over the past three months running at a contractionary -1.3% annual rate. But according to Fed Chair Jerome Powell, the economy is “strong.” Is this the same ‘head-in-the-sands’ comment that Ben Bernanke espoused in 2007 when he stated that home prices never go down on a nationwide basis and that the problems in subprime mortgages would remain “contained?” Fed governors in the U.S. have clearly dialed back any dovish views on interest rates since they don’t want to risk a reacceleration of inflationary pressures and have to start tightening financial conditions further. We don’t think that is a risk right now. The chart below of the Citi Economic Surprise Index for the U.S. shows how the reality of the numbers versus the expectations has been on a clear downward trend for over a year now.
1 2
Our investment management team is made up of engaged thought leaders. Get their latest commentary and stay informed of their frequent media interviews, all delivered to your inbox.