Keep connected
Our investment management team is made up of engaged thought leaders. Get their latest commentary and stay informed of their frequent media interviews, all delivered to your inbox.
John Zechner
August 29, 2017
Why has the ‘greenback’ been under such pressure? Sentiment indicators suggest that this was a fairly ‘crowded trade,’ meaning that the 50% rise in the trade-weighted dollar since 2014 had attracted a lot of attention and speculators had loaded up on this position. Once the consensus becomes that strong, the trade often tends to go in the other direction. Also, while the U.S. Federal Reserve increased interest rates last December as well as March and June of 2017, the worry is now that they may not increase rates again anytime soon, especially since they also announced that they want to start winding down the US$4.5 trillion balance sheet debt they had accumulated during their Quantitative Easing programs. Economic growth in Europe and Japan have also been a bit stronger than expected this year, leading to some views that their central banks may also start removing some of the monetary stimulus of the past few years. That lead to some money flows into the Euro and the Japanese Yen. But the biggest impact on the U.S. dollar this year, in our view, has been disappointment in U.S. growth due to the policy inaction of the new U.S. administration as well as the simple age of the current expansion, which began way back in 2009. Low unemployment levels are more indicative of the end of the economic cycle than the beginning, since they usually precede wage growth and rising interest rates. While stocks have grinded to new highs in the U.S., the dollar has given back all of its gains and more since the Trump election win. A weaker currency is clearly a warning sign in our view.
Backing up our worries about U.S. growth in 2017 we looked at the annual growth in bank loans in the U.S. Commercial and Industrial bank loan activity has always been closely correlated with economic growth since companies borrow to expand during good times and tend to reduce borrowings when the outlook is less certain. The chart below shows loan growth in the U.S. over the past 22 years and we can certainly see the sharp downturn during the financial crisis and the quick recovery based on the major stimulus that followed. Then we saw a slowdown again in 2012 following the European debt crisis and the Asian downturn. Following some good recoveries in loan growth in 2014-2016 we have seen a sharp downturn again in 2017. This seems totally at odds with the consensus view that the U.S. economy is re-accelerating following the election of Donald Trump. But businesses are clearly ‘talking the talk’ rather than ‘walking the walk’ when it comes to turning increased business confidence into actual borrowing and spending. The increased rhetoric with North Korea, the troubled trade relations with China and NAFTA, the deteriorating relations with key European leaders and the continued inability to deliver on health care, infrastructure spending and tax reform will do nothing to improve those worries so we don’t expect to see any gains in U.S. economic growth for the balance of 2017. This presents just one more risk for stock market investors that we believe is under-estimated.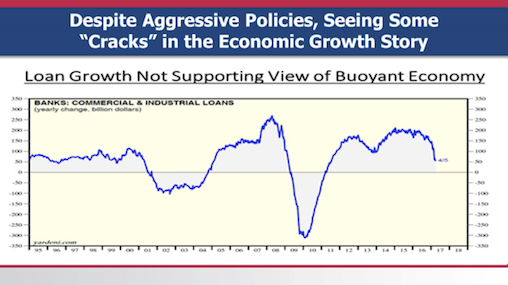
So what areas do we see some investment opportunities in? Once again we think it makes more sense to look at some of the ‘out of favour’ sectors where poor sentiment and difficult conditions have lead to an exodus of funds and perhaps some better longer-term valuations. The chart below shows the relative strength of the S&P 500 Energy sector versus the S&P500 going back to August 1989. When the line is rising, it indicates periods where Energy is outperforming the S&P500, while periods of Energy sector underperformance are indicated by falling lines. The period from September 1990 through January 1999 was one where the sector was out of favour, and it was towards the end of it when Exxon merged with Mobil and then Chevron merged with Texaco. At the time those mergers were announced, the sector was in the midst of putting in a multi-year bottom that sparked a nine-year period of major outperformance by the sector. Like all good parties, though, the music eventually stopped for the Energy sector in July 2008 just as the Financial Crisis was unfolding. From that July/08 peak until now, the Energy sector has been a major underperformer versus the S&P500 and given up nearly all of its prior outperformance. Even more noteworthy, though, is the fact that the current period of underperformance has now lasted longer (9 years, 1 month) than the 8 years and 4-month stretch that spanned the majority of the 1990s. 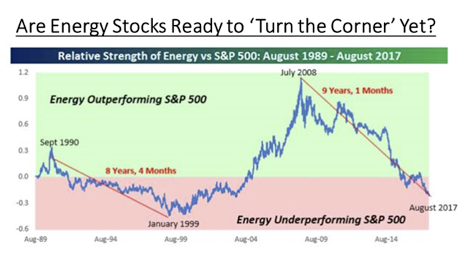
In addition to the extended period of under-performance, the valuation of Energy stocks, using US$48 as a long-term price for oil, has become cheaper than it has been since the Financial Crisis. Companies have been selling off redundant assets, consolidating properties, reducing debt and trying to bring down operating costs. Many major Canadian producers are now poised to generate positive earnings/cash flow at prices as low as US$40 per barrel. While the longer-term dynamics of the oil market is still clouded by growing global production, cheapening non-fossil fuel alternatives and the ultimate negative impact on demand from the growth of electric vehicles, the current weakness in the U.S. dollar and supply constraints from some OPEC nations, the Energy index looks like a good bet to recover some of the under-performance from the past nine years!
But we have to finish with some more worries and risks in the global financial outlook, starting with the massive increase in sovereign debt. Debt racked up by China’s government, companies and households will likely balloon to almost 300% of gross domestic product by early next decade, the International Monetary Fund projected in its annual review of the country’s economy. The problem is that the rest of the global economy has become dependent on China’s stronger growth profile to support global demand for commodities and other basic resources supplying infrastructure spending. Global growth since the 2007-2009 crisis would be slower and more dependent on the U.S. without this massive stimulus spending funded by Chinese borrowing. The 2% growth in the U.S. and Europe is not significant enough to carry that demand. The IMF acknowledged that gross domestic product, adjusted for inflation, would probably have grown only about 5.5% annually over the past four years instead of 7.25% if not for these extreme levels of borrowing. At some point, China will further cool its engines and accept slowing growth. Good times over the past few years have been paid for by borrowed funds and, at some point, this is going to become too much of a burden to carry. Growth will slow down and financial markets will take a hit. We continue to think that we are closer to that time than most investors realize!
1 2
Our investment management team is made up of engaged thought leaders. Get their latest commentary and stay informed of their frequent media interviews, all delivered to your inbox.