Keep connected
Our investment management team is made up of engaged thought leaders. Get their latest commentary and stay informed of their frequent media interviews, all delivered to your inbox.
John Zechner
June 1, 2017
While stock markets did meander around the break-even line in May, there were a few specific warning signs that should not be ignored in terms of the market outlook. The financial sector gave up all of this year’s gains in May, sending the broader market a message about the health of the economy. The sector was one of the leading sectors early this year and was up 9% as of the beginning of March. The recent drop has been a function of interest rates falling again, along with ongoing concerns about global growth. The yield curve, which serves as a gauge of economic growth, has flattened on the year, and generally that does not bode well for the banks, which rely on healthy net interest margins. Financials underperforming in a falling-interest-rate environment flashes a vote of non-confidence in economic growth. U.S. Financials are now the third-worst-performing sector (just ahead of the telecommunications and energy sectors) so far in 2017.
Elsewhere, while European growth is recovering nicely, Chinese econmic growth continues to look like it is hitting a few ‘speed bumps.’ The Chinese Caixin PMI dropped below the critical 50 level in May (the line between expansion and contraction) as property sales dropped as much as 40% year-over-year. This is important since property sales in China tend to be a lead indicator for steel prices in China, which are then a leading indicator for steel prices in North America. With met coal, copper and iron ore prices all heading lower this year, the writing appears to be on the wall for industrial growth.
Moving on to where we do see risks to the economy and the markets, the level of global debt has to be high on that list. While record low interest rates have reduced the cost of servicing those debts, the principal does have to be paid back at some point in time. U.S. household debt reached a record high in the first three months of this year, topping the previous peak reached in 2008, when the financial crisis plunged the economy into a deep recession. Americans have stepped up borrowing over the past three years. Meanwhile, that household debt, which also includes home equity lines of credit, stood at $12.73-trillion in the first quarter of 2017. That’s above the $12.68-trillion outstanding in the fall of 2008, the previous record.
Another significant debtor is the U.S. central bank, The Federal Reserve. As shown in the chart below, the buying of Treasury and other bonds in the U.S. by the Fed has taken their balance sheet from debt of under $1 trillion in 2008 to over $4.5 trillion today. with the economy now on somewhat better footing in the U.S., the Fed has recently announced their plan to start reducing this debt by selling down its holdings of bonds.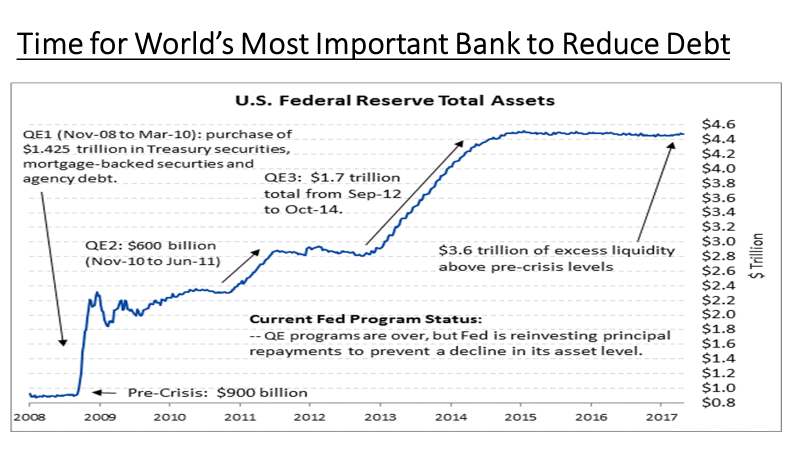
The markets have not expressed any particular concern thus far about the Fed’s balance sheet draw-down. However, that could change as the date approaches for when the Fed steps aside as a big buyer of Treasury securities to replace maturing securities and starts draining excess reserves from the banking system. The market consensus is that they will officially announce their balance sheet policy change at its September meeting with the actual draw-down beginning late this year or on January 1.
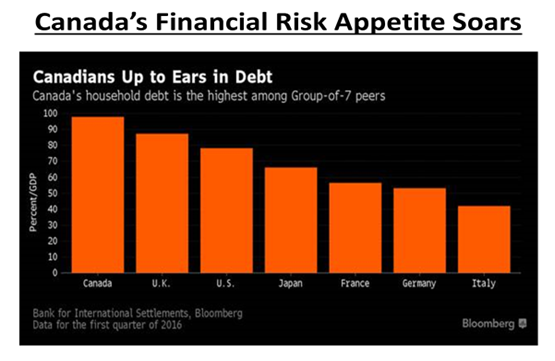
Staying on the debt theme, Canadians have spent much of the past few years at the ‘debt trough’ as well, amassing the largest consumer debt-to-GDP ratio in the industrialized world. While low interest rates have up here has also made the servicing of the debt more manageable for now, we can see why foreign investors are worried about our financial institutions. With our housing market experiencing pricing booms, particularly in the key urban centres of Vancouver and Toronto, the risk level has to be viewed as ‘elevated.’ The funding crisis and ensuing stock price debacle at Home Capital Group in the past month may end up being the ‘canary in the coal mine’ for the domestic housing market.
Our investment management team is made up of engaged thought leaders. Get their latest commentary and stay informed of their frequent media interviews, all delivered to your inbox.