Keep connected
Our investment management team is made up of engaged thought leaders. Get their latest commentary and stay informed of their frequent media interviews, all delivered to your inbox.
Jacqueline Ricci
February 7, 2017
2016 is in the books!
On the whole, 2016 was a very good year for Canadian equities, with Canadian small cap stocks outpacing most global markets. For 2016, the J. Zechner Special Equity Fund was up 44.4% and the TSX Small Cap Index was up almost 38.5%.
Below is a table of global equity returns.
|
October |
November |
December |
2016 |
|
| JZA Special Equity Fund |
-1.1% |
-0.3% |
-0.2% |
+44.4% |
| S&P TSX |
+0.6% |
+2.2% |
+1.7% |
+21.1% |
| S&P TSX Small Cap |
+2.6% |
+2.0% |
+3.9% |
+38.5% |
| S&P 500 |
+0.3% |
+3.9% |
-2.0% |
+8.6% |
| MSCI Emerging |
+2.4% |
-4.4% |
+0.3% |
+8.3% |
Much of the outperformance was a result of being in the gold sector early in the year and then reducing this weight in favour of oil stocks in the latter half of 2016. Strong security selection contributed over 27% versus the SPTSX, and sector allocation was a small negative (-4%). While the fund outperformed the S&P TSX by 23.3% in 2016, the fund did underperform in the fourth quarter by -6.1%. This was largely a result of being underweight financials and overweight gold stocks (even though we reduced gold exposure by 11% in the third quarter).
Below are the current portfolio sector exposures and a table highlighting the changes in sector exposure last year: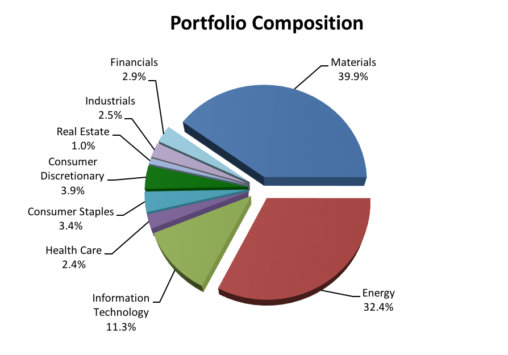
| Sector | Portfolio (Dec 2016) |
Portfolio (Dec 2016) |
+/- |
| Energy |
32.4% |
16.3% |
16.1% |
| Materials |
39.9% |
33.9% |
6.0% |
| Real Estate |
1.0% |
0.0% |
1.0% |
| Consumer Staples |
3.4% |
3.4% |
0.0% |
| Utilities |
0.0% |
1.0% |
-1.0% |
| Cash |
0.0% |
1.8% |
-1.8% |
| Financials |
2.9% |
4.7% |
-1.8% |
| Health Care |
2.4% |
6.0% |
-3.6% |
| Industrials |
2.5% |
6.7% |
-4.2% |
| Consumer Discretionary |
3.9% |
8.4% |
-4.5% |
| Information Technology |
11.3% |
17.9% |
-6.6% |
| Total |
100.0% |
100.0% |
Our investment management team is made up of engaged thought leaders. Get their latest commentary and stay informed of their frequent media interviews, all delivered to your inbox.